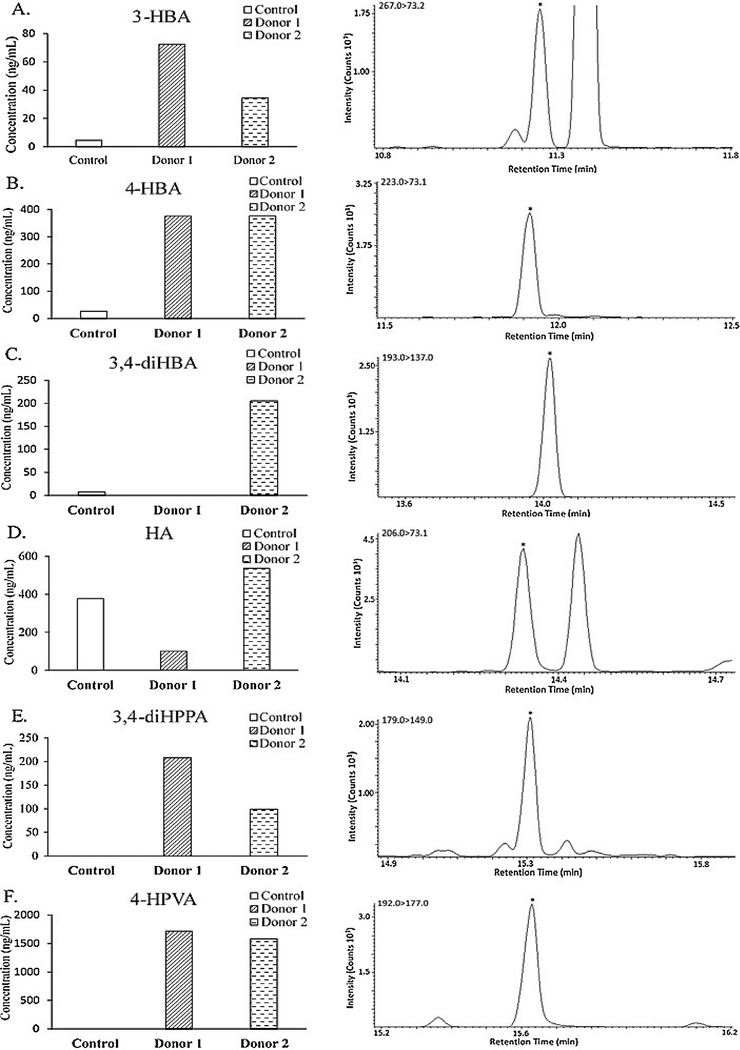
Fig. 2.
Concentration changes and MS identification of select phenolic acid metabolites derived from catechin/epicatechin in broth samples fermented with human gut microbiota in vitro.Left column (charts A-F): average concentrations (ng/mL) of phenolic acid metabolites in control and samples fermented with microbiota from Donor 1 and 2. Right column: mass chromatograms showing the corresponding peaks of parent-to-target ion transition for identifying the target analyte, with chromatograms A, B, D, E and F selected from a representative Donor 1 sample and chromatogram C from a representative Donor 2 sample. Abbreviations are the same as in Table 1.

