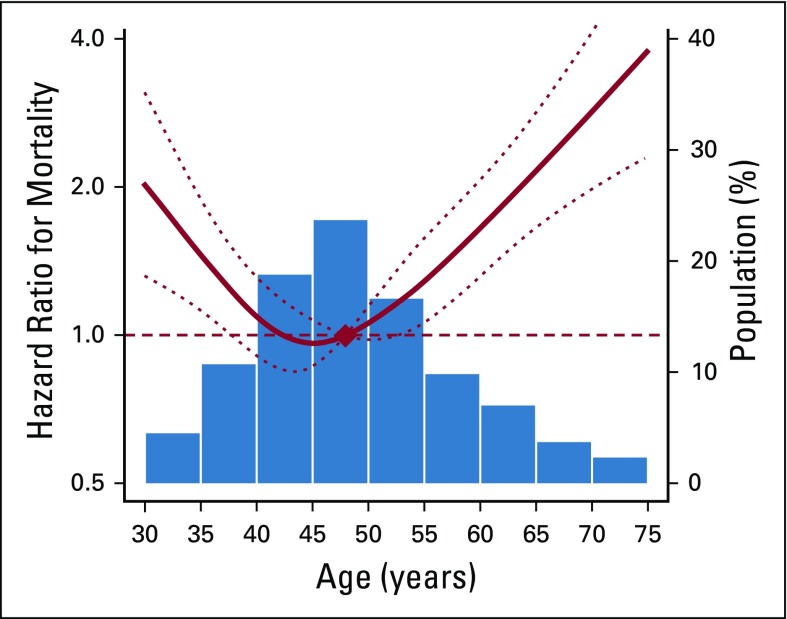
FIG 2.
Hazard ratios for overall mortality by age. Curves represent adjusted hazard ratios (solid lines) and their 95% CIs (dotted lines) on the basis of restricted cubic splines for age with knots at the fifth, 35th, 65th, and 95th percentiles (34, 44, 51, and, 67 years, respectively) of their sample distributions. The reference values (diamond dot) were set at the 50th percentile (47 years). Adjusted for age, body mass index, stage, and treatment, including surgery, chemotherapy, and radiotherapy.

