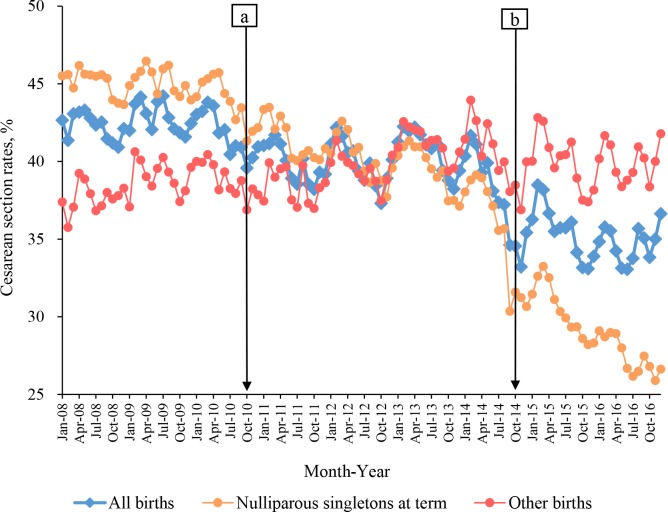
Fig 1. The trend of CS rates in all births, nulliparous singletons at term, and other births in Guangzhou, China, 2008–2016.
Blue circles: CS rates for all births; orange: CS rates for nulliparous singletons at term; red: other births. Baseline: from January 2008 to September 2010; Stage 1: from October 2010 (Point “a”) to September 2014; Stage 2: from October 2014 (Point “b”) to December 2016. CS, cesarean section.

