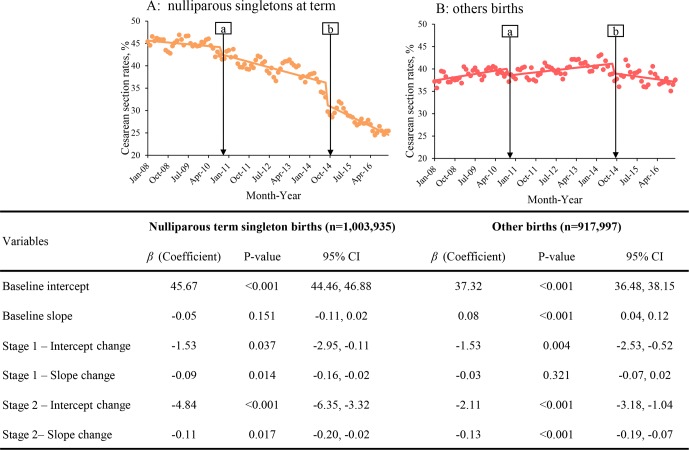
Fig 2. Segmented linear regression models of age-standardized CS rates in nulliparous singletons at term (A) and other births (B) in Guangzhou, China, 2008–2016.
Dots indicate true monthly CS rates; solid lines indicate the mean of estimated CS rates per month. Baseline: from January 2008 to September 2010; Stage 1: from October 2010 (Point “a”) to September 2014; Stage 2: from October 2014 (Point “b”) to December 2016. Age-standardized CS rate was calculated by the direct method using 2008 population in each group in the study. Variables listed were modeled along with autoregressive terms by subset models that list the lags in the autoregressive model. Intercept change: change in level compared with the previous stage; slope change: change in trend compared with the previous stage, per month. CS, cesarean section.

