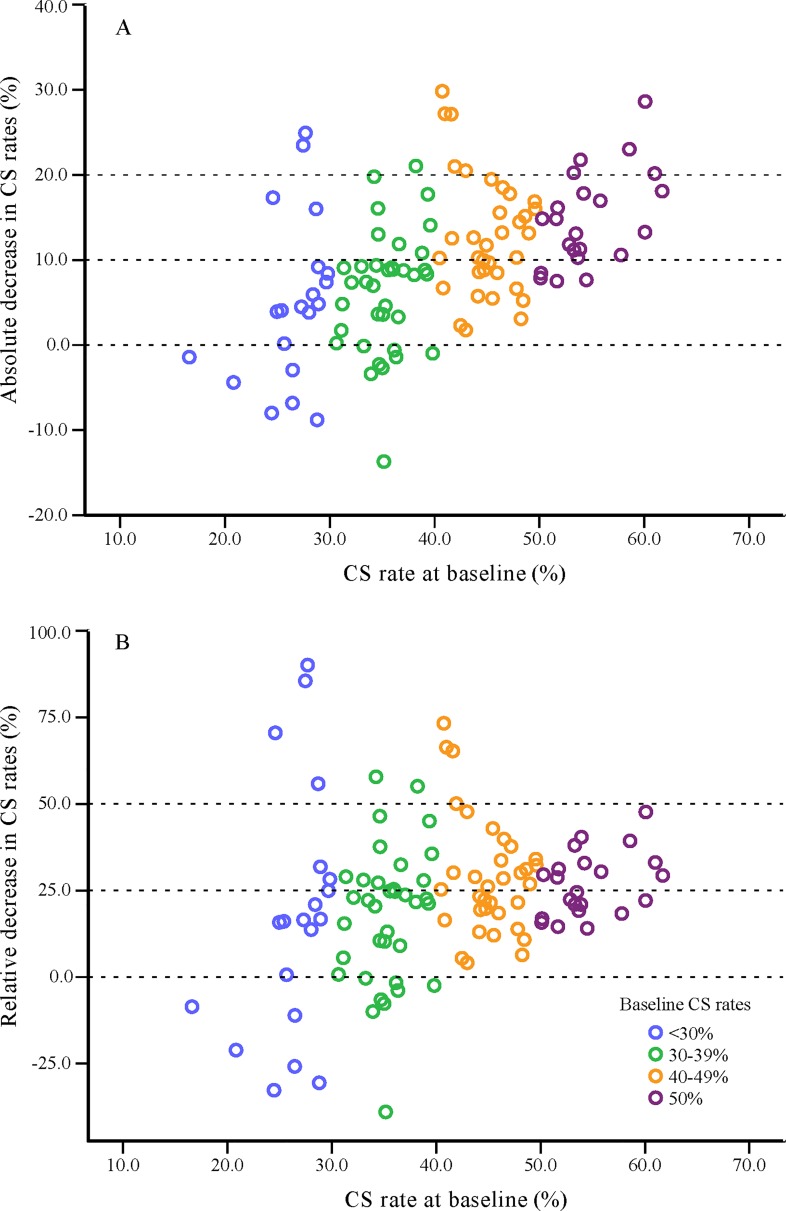
Fig 4. Scatter plot for the absolute decrease in CS rates (A) and the relative decrease in CS rates (B) from 2008 to 2016 among hospitals in Guangzhou grouped by their baseline CS rates.
A total of 112 hospitals with more than 100 live births both at baseline and in Stage 2 were included and were grouped by their baseline CS rates. One circle represents one hospital, with blue (n = 20), green (n = 36), orange (n = 34), and purple (n = 22) representing baseline CS rates of <30%, 30%–39%, 40%–49%, and ≥50%, respectively. The absolute decrease = the CS rate at baseline − the CS rate in Stage 2; the relative decrease = (the CS rate at baseline − the CS rate in Stage 2) ÷ the CS rate at baseline. CS, cesarean section.

