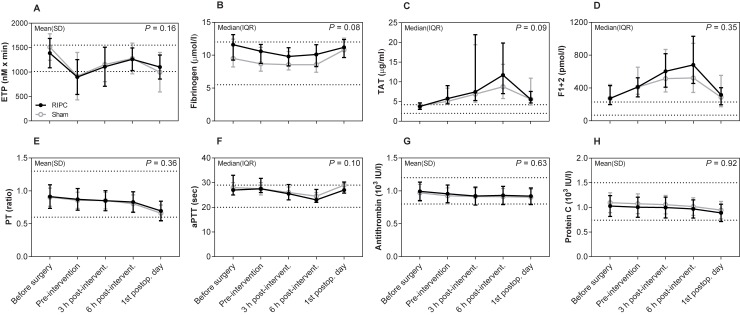
Fig 4. Thrombin generation, secondary hemostasis, and natural anticoagulants.
Data are shown as mean ± SD or median with IQR. Lines indicate common reference intervals for healthy men and women from our laboratory if available. Reference intervals for TAT and F1+2 were provided by the manufacturer. P-values represent the multivariate repeated measures ANOVA. Mixed-model was used for ETP. Missing data: Thrombin generation produced flat curves in 4 samples obtained pre-intervention (3 RIPC, 1 sham) and in 4 samples obtained on the first postoperative day (3 RIPC, 1 sham). Abbreviations: aPTT: activated partial thromboplastin time, ETP: endogenous thrombin potential, F1+2: prothrombin fragment 1+2, PT: prothrombin time, RIPC: remote ischemic preconditioning, TAT: thrombin-antithrombin complex.

