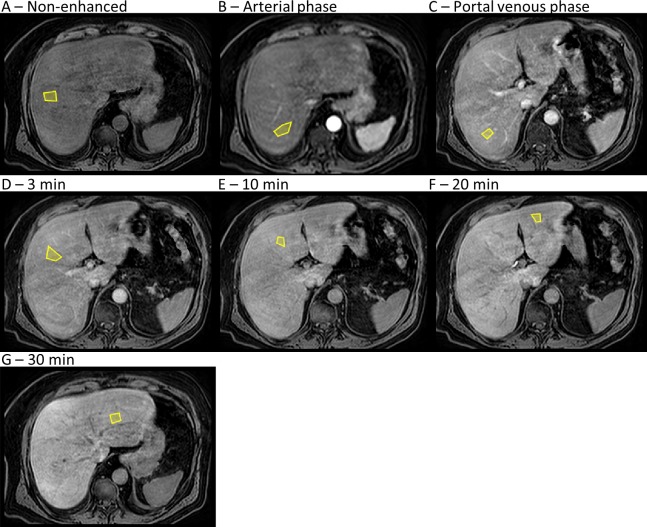
Fig 5. Gadoxetate MRI time series of the liver.
(A-G) Representative placement of seven regions of interest (yellow polygons) within the liver, of which four (A-D) were placed in the right liver lobe and three (E-G) were placed in the left liver lobe. This set shows an entire time series in a single patient, from before gadoxetate injection (A) to 30 min after gadoxetate injection (G). The arterial phase (B) typically occurs 30 s after gadoxetate injection, and the portal-venous phase (C) typically occurs 1 min after gadoxetate injection.

