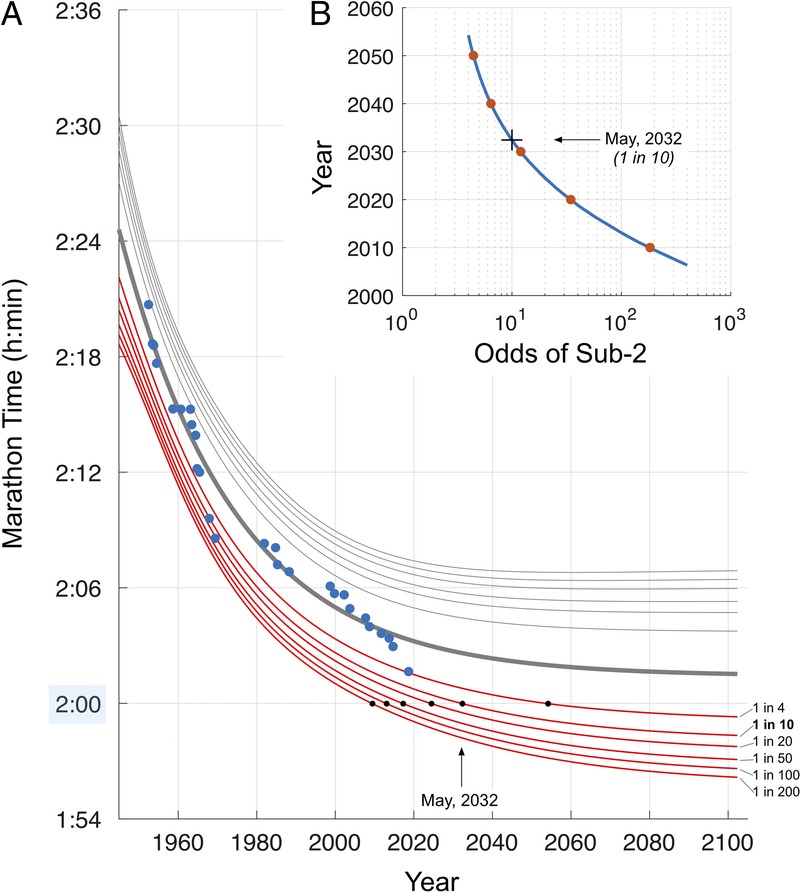
FIGURE 1.

The progression of the male marathon world record, 1950 to present. A, Official IAAF marathon times, normalized such that 120 min = 1.0, vs year (blue markers), together with expected value model fit (thick gray line) and realizations of the upper (light gray) and lower (red) prediction intervals at odds levels as given. Black markers indicate crossing points with lower prediction bounds (see text for details), with the benchmark “1 in 10” odds crossing point indicated by an arrow. B (Inset), Continuous realizations of the sub–2-h crossing point for a variety of odds, crossings with decades 2010 … 2050 indicated by red markers, with 1 in 10 odds crossing shown by black cross and arrow (see text for details).
