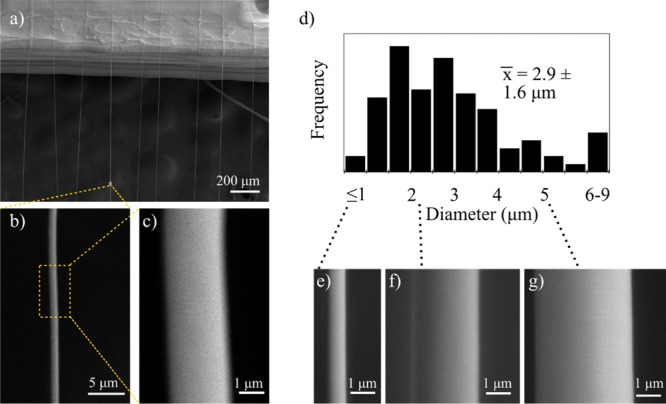
Figure 4.

Microstructure characterization within a suspended layer of fibers. An SEM image of a layer of suspended fibers shown in (a) a single fiber is presented at different magnifications in (b) and (c). (d) Histogram of the measured individual fiber diameters with (e)–(g) showing SEM images of fibers at the lower, median, and upper size range, respectively.
