FIG 2.
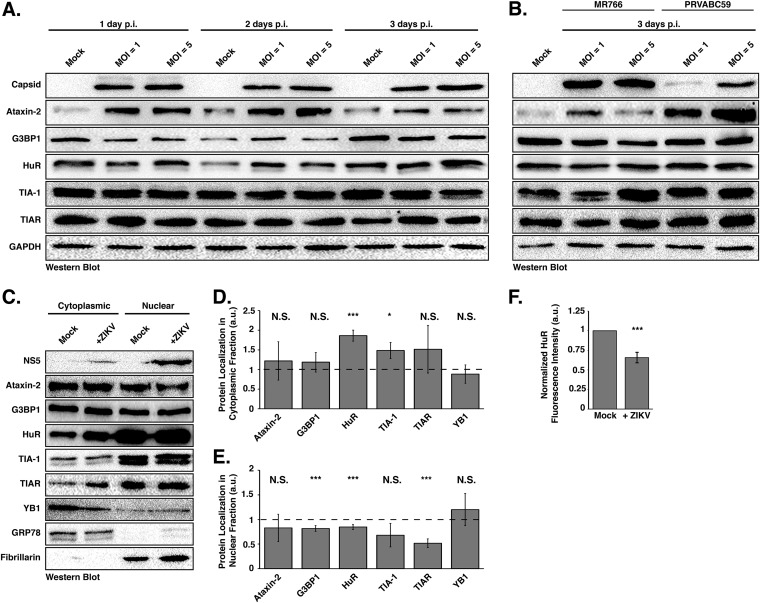
ZIKV infection changes the nuclear and cytoplasmic distribution of stress granule proteins. (A) Huh7 cells infected with the Cambodia strain of ZIKV at an MOI of 1 or 5 were harvested at 1, 2, and 3 days postinfection. Detection of ZIKV capsid protein by Western blotting confirmed viral infection. The abundance and integrity of Ataxin-2, G3BP1, HuR, TIA-1, and TIAR proteins were also examined at each time point. The Western blot shown is representative of at least three independent experiments. (B) Western blot analysis of SG proteins in MR766- and PRVABC59-infected Huh7 cells 3 days postinfection. (C) Cytoplasmic and nuclear distribution of Ataxin-2, G3BP1, HuR, TIA-1, TIAR, and YB1. Huh7 cells were mock infected or infected with the Cambodia strain of ZIKV at an MOI of 5, and 1 day postinfection the cytoplasmic and nuclear fractions were isolated. The distribution of ZIKV NS5, Ataxin-2, G3BP1, HuR, TIA-1, TIAR, YB1, GRP78, and Fibrillarin was analyzed by Western blotting. The Western blot shown is representative of the three independent experiments performed. (D and E) Quantification of the distribution of Ataxin-2, G3BP1, HuR, TIA-1, TIAR, and YB1 in the cytoplasmic (D) and nuclear (E) subcellular fractions. The abundance of each SG protein in the cytoplasmic or nuclear fraction was standardized against GRP78 or Fibrillarin, respectively. These values were then normalized against the abundance of the specific SG protein in mock-infected cells, which was assigned an arbitrary unit (a.u.) of 1 (denoted by dashed lines on each graph). The data presented in panels D and E were calculated from three independent infections, fractionations, and immunoblots. (F) Quantification of fluorescence intensity signal of the localization of HuR in the nucleus. Fluorescence intensity was derived in ImageJ using a freehand selection of the nucleus in mock- and ZIKV-infected cells. Values obtained for HuR were divided by the nucleus signal (Hoechst) within mock- and ZIKV-infected cells. Fluorescence intensity of the infected cells was standardized against that of mock-infected cells and arbitrarily assigned a value of 1. The relative fluorescence intensity signal was calculated from three independent experiments, and nine cells were counted per experiment. Two-tailed Student t tests were performed to calculate significance. *, P < 0.05; ***, P < 0.001; N.S., not significant.

