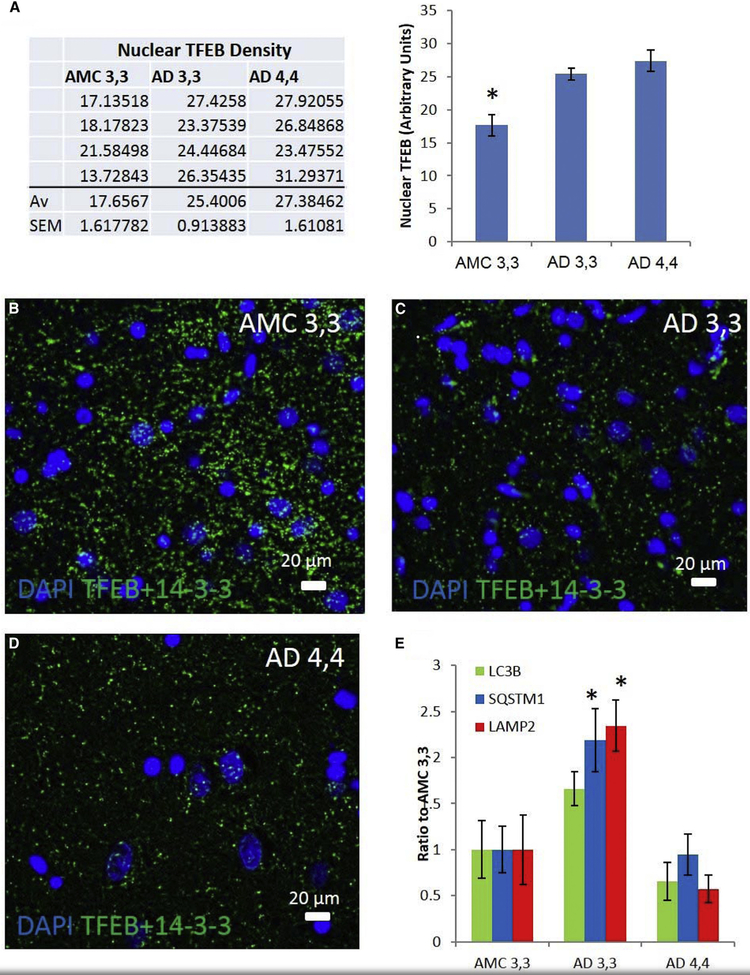
Fig. 1.
AD patients demonstrate elevation of nuclear TFEB in patient carriers of both APOE ε3/ε3 (AD 3,3) and APOE ε4/ε4 (AD 4,4) compared to AMC ε3,3, while mRNAs are elevated only in AD 3,3. (A) Nuclear partitioning of TFEB was assessed by analysis of immunofluorescence histochemistry images of human hippocampal CA1 pyramidal cells in AD and AMC patients. Groups (each n = 4): AMC APOE ε4/ε4; AD 3,3; and AD 4,4 were compared by ANOVA, with Bonferroni-corrected α = 0.0167. AMC 3,3 versus AD 3,3 P = .006; AMC 3,3 versus AD 4,4 P < .01; AD 3,3 versus AD 4,4 P = .33. (B–D) Proximity ligation assay was used to illustrate the AD-related changes in cytoplasmic 14-3-3/TFEB complexes in an AMC patient, an AD 3,3, and an AD 4,4. (E) The relative levels (mRNA/18S) of MAP1LC3B, SQSTM1, and LAMP2 transcripts were determined by real-time RT-PCR in hippocampal specimens from AD and AMC patients, analyzed by disease state and separated by APOE genotype. Histogram shows means ± SEM. Significance of differences from AMC 3,3 (n = 6) was determined by two-tailed t-tests within ANOVA (Bonferroni-adjusted α < 0.02): P = .01 for AD 3,3, n = 5; and P < .01 for AD 4,4, n = 6. Abbreviations: AD, Alzheimer’s disease; AMC, age-matched control; APOE, apolipoprotein E; TFEB, transcription factor EB. *P = .05.

