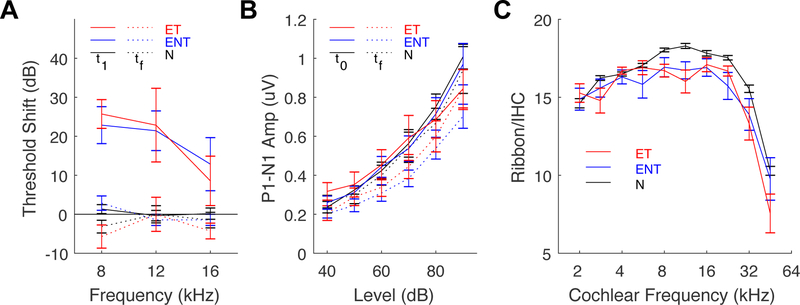
Fig. 3: Measures of cochlear pathophysiology and histopathology do not differ between animals with tinnitus and those without tinnitus.
(A) ABR threshold shifts immediately following noise exposure (t1, solid lines) and 12 weeks following noise exposure (tf, dashed lines). (B) ABR wave-1 amplitude (P1–N1) before (t0, solid lines) and 12 weeks after noise exposure (tf, dashed lines). (C) Ribbon synapse counts per IHC, as sampled at 10 locations along the cochlear spiral, converted to frequency according cochleotopic mapping. Exposed-tinnitus animals - red, exposed no-tinnitus animals (ENT) - blue, and sham-exposed normal animals (N) - black for all panels. Adapted from Heeringa et al. (2018a).

