
Figure 2.
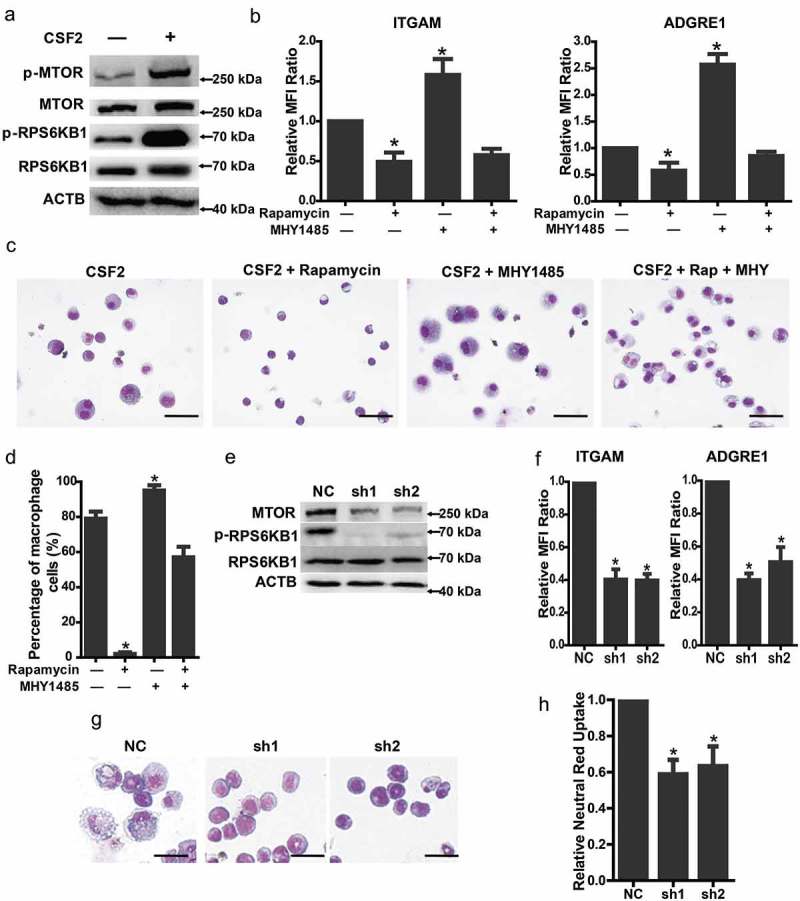
MTOR regulates macrophage differentiation from myeloid progenitors. (a) The indicated protein markers in the mEB8-ER cells treated with/without CSF2 (2 ng/mL, 24 h) were tested with western bloting. (b-d) The mEB8-ER cells were induced with 2 ng/mL CSF2 and treated with or without 1 μM rapamycin or 10 μM MHY1485 for 5 days. The protein level of ITGAM and ADGRE1 was quantified by flow cytometry (b), All values were normalized to the level (= 1) in cells with only CSF2 treatment. *P < .05. Wright-Giemsa staining was performed, and the percentage of macrophage cells was counted. Bar: 50 μm (c, d). (e) The indicated protein markers in mEB8-ER cells with Mtor knockdown were tested by western blotting. NC denotes the empty retrovirus-vector. (f-h) The infected cells were induced with CSF2 (2 ng/mL) for 5 days. The protein level of ITGAM and ADGRE1 was quantified with flow cytometry (f). The morphological changes were evaluated with Wright-Giemsa staining (Bar: 20 μm) (g), and phagocytosis was tested by the use of the neutral red uptake assay (h). All values were normalized to the level (= 1) in NC cells. *P < .05. All experiments were repeated 3 times and produced similar results. All values were shown as means ± SEM of 3 independent experiments.