
Figure 1.
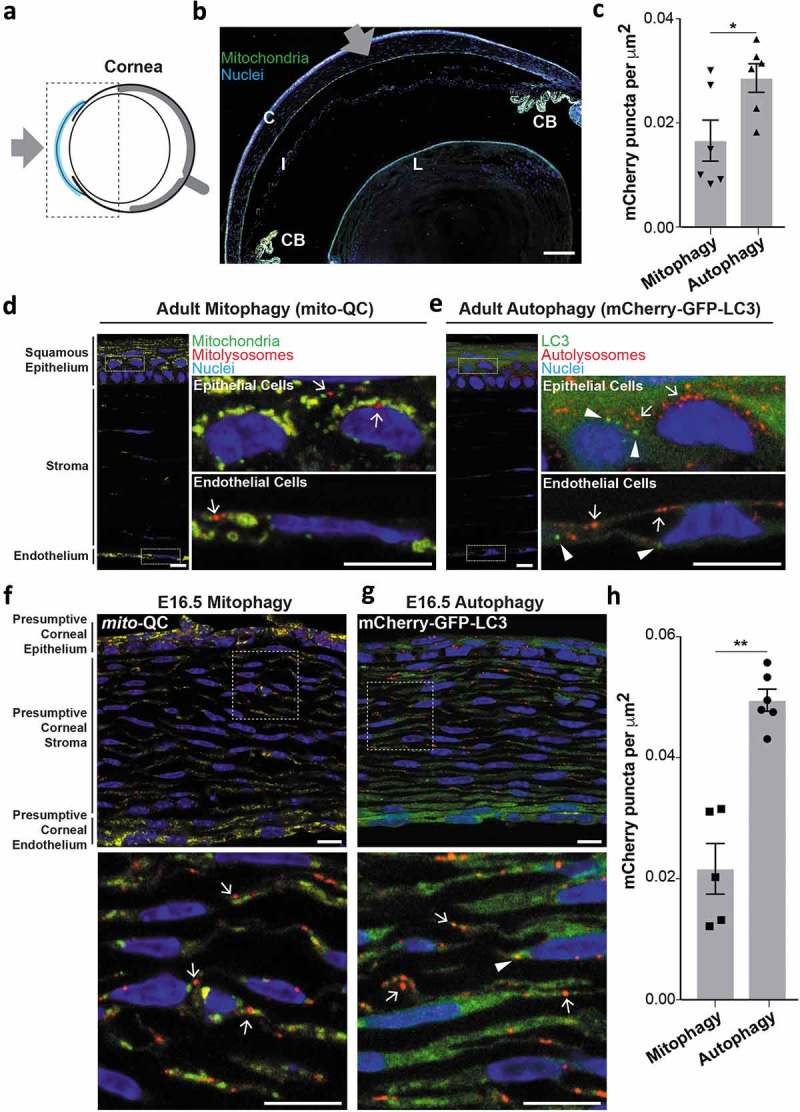
Basal mitophagy and macroautophagy in the cornea. (a) Schematic of the mouse eye depicting location of cornea in blue. Boxed area shown in panel (b). Gray arrow represents the light path i.e. direction of light entering the eye. (b) Overview micrograph of mito-QC eye section depicting cornea (C), iris (I), ciliary body (CB) and lens (L). Gray arrow represents light path. Scale bar: 100 μm. (c) Quantification of mCherry-only puncta from mito-QC (mitophagy) or mCherry-GFP-LC3 (autophagy) corneal eye sections. Data points are means from individual animals ±SEM (*P < 0.05 (0.0342)). (d) Representative mito-QC optical section showing mitophagy in the cornea. Boxed regions are shown magnified on the right and arrows mark instances of mitophagy defined by the presence of mCherry-only mitolysosomes. (e) Representative mCherry-GFP-LC3 section showing autophagy in the cornea. Boxed regions are shown magnified on the right and arrows mark examples of autolysosomes and arrowheads indicate presumptive autophagosomes. (f) Optical section detailing pronounced mitophagy in the mito-QC E16.5 corneal stroma. Boxed region is shown magnified below with arrows marking examples of mitolysosomes. (g) Optical section detailing autophagy in the mCherry-GFP-LC3 E16.5 corneal stroma. Boxed region is shown magnified below with autolysosomes (arrows) autophagosomes (arrowheads). (h) Quantification of mCherry-only puncta from mito-QC (mitophagy) or mCherry-GFP-LC3 (autophagy) E16.5 corneal eye sections. Data points are means from individual animals ±SEM (**P < 0.01 (0.0012)). Scale bars (panels d-g): 10 μm.