
Figure 4.
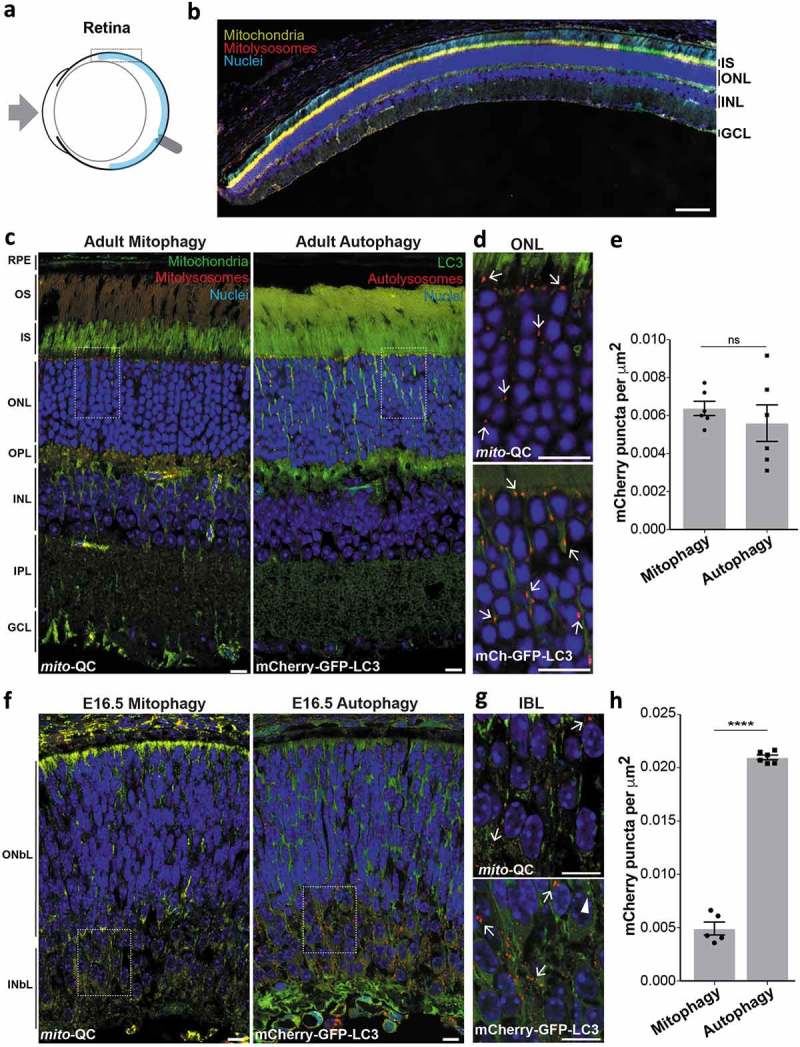
Mitophagy is highly localized to retinal photoreceptors. (a) Schematic of the mouse eye depicting anatomical location of the retina in light blue. Boxed region is shown in b. (b) Optical section from mito-QC retina: IS, inner segment; ONL, outer nuclear layer; INL; inner nuclear layer; GCL, ganglion cell layer. Scale bar: 100 μm. (c) Optical sections from mito-QC and mCherry-GFP-LC3 retina. Boxed regions are shown in panel D. RPE, retinal pigment epithelium; OS, outer segment; OPL, outer plexiform layer; IPL, inner plexiform layer. (d) Magnified section of ONL from mito-QC (top panel) or mCherry-GFP-LC3 adult retina (bottom panel). Arrows mark examples of mitophagosomes or autolysosomes. (e) Quantification of mCherry-only puncta from mito-QC (mitophagy) or mCherry-GFP-LC3 (autophagy) retinal sections, including all the layers shown in panel C. Data points represent means from individual animals ±SEM (ns = P > 0.05 (0.4772)). (f) Optical sections from mito-QC and mCherry-GFP-LC3 E16.5 retina. Boxed regions are shown in panel G. ONbL, outer neuroblast layer; INbL, inner neuroblast layer. (g) Magnified section of INbL from mito-QC (top panel) or mCherry-GFP-LC3 E16.5 retina (bottom panel). Arrows mark examples of mitophagosomes or autolysosomes and arrowhead indicates an autophagosome. (h) Quantification of mCherry-only puncta from mito-QC (mitophagy) or mCherry-GFP-LC3 (autophagy) E16.5 retinal sections. Data points represent means from individual animals ±SEM (***P < 0.0001). Scale bars (c-g): 10 μm.