
Figure 6.
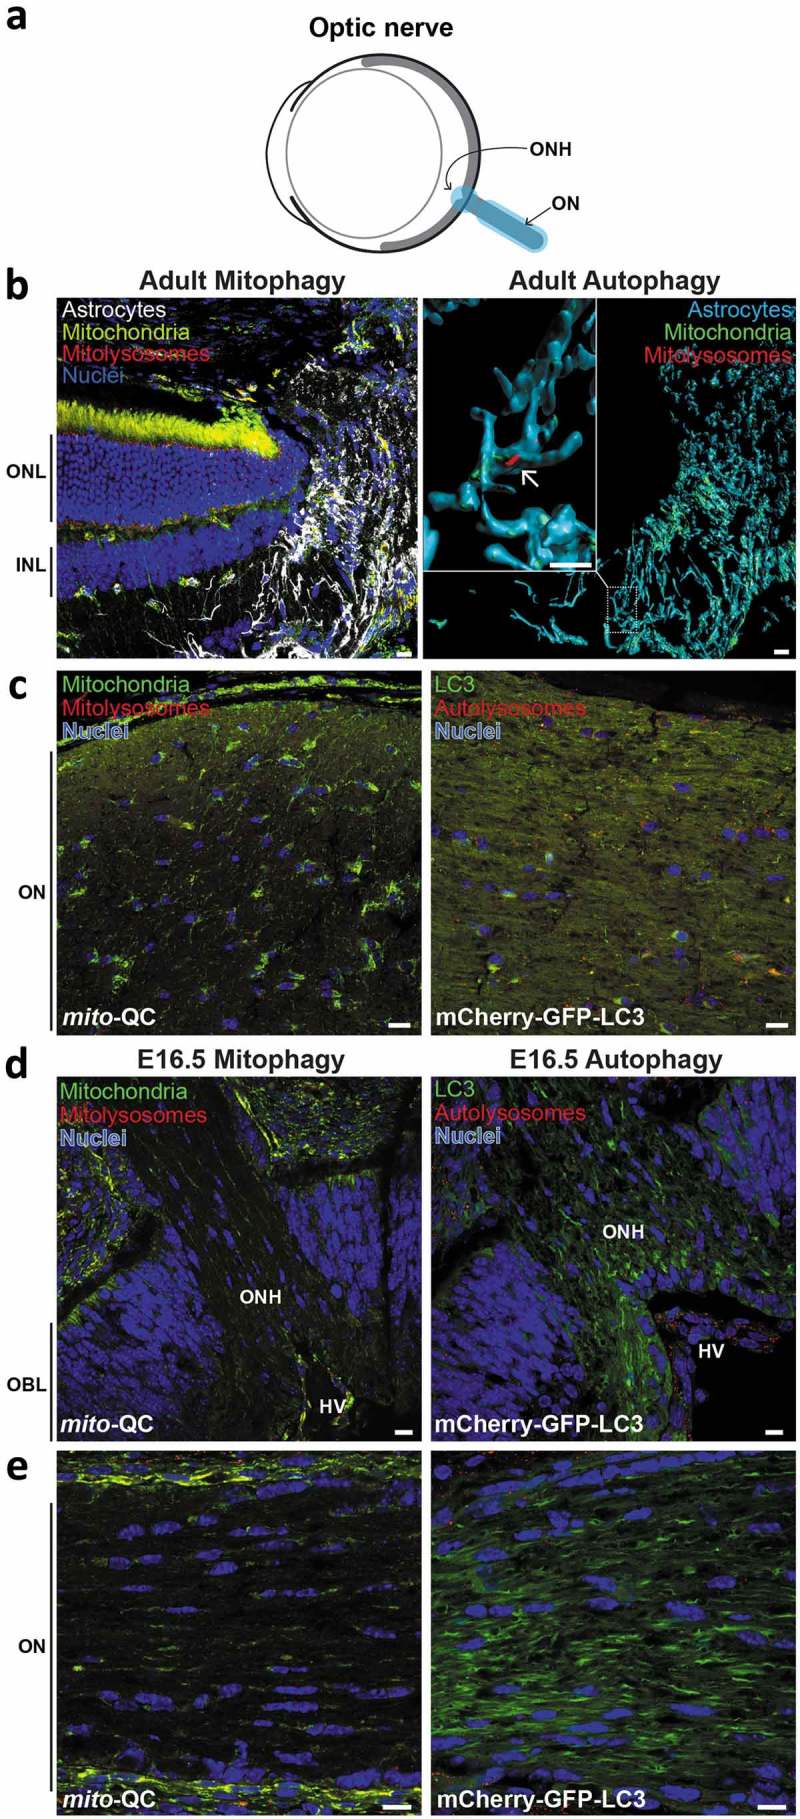
Minimal mitophagy and macroautophagy in the optic nerve. (a) Schematic of the mouse eye depicting anatomical location of the optic nerve in light blue. (b) Z-projection showing ONH of adult mito-QC eye, stained with anti-GFAP to mark astrocytes (white, left panel). Note retina on the left with outer nuclear layer (ONL) and inner nuclear layer (INL) marked. Right panel shows isosurface rendering of the ONH astrocytes (cyan) and boxed region is shown enlarged to the left. Mitolysosomes are sparse and the arrow indicates an example. (c) Optical section of ON from mito-QC (left panel) or mCherry-GFP-LC3 (right panel) eye. (d) Optical section of ONH from mito-QC (left panel) or mCherry-GFP-LC3 (right panel) E16.5 eyes. Outer neuroblast layer (OBL) of the developing retina is indicated. (e) Optical section of ON from mito-QC (left panel) or mCherry-GFP-LC3 (right panel) E15.5 eyes. Scale bars: 10 μm.