
Figure 4.
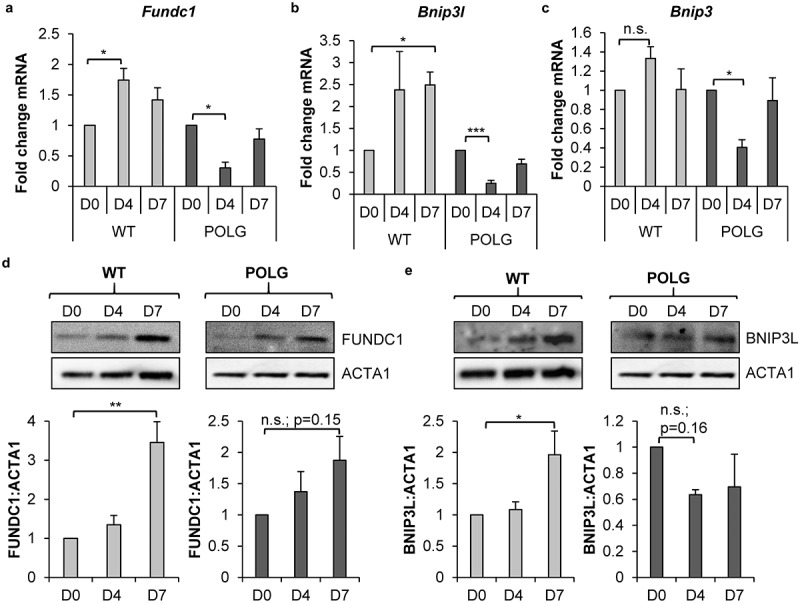
Mitophagy receptors are upregulated in WT CPCs upon differentiation. Real-time PCR analysis of mitophagy receptors (a) Fundc1, (b) Bnip3l and (c) Bnip3 transcript levels in WT and POLG CPCs at baseline and after incubation in DM (n = 4). (d) Representative western blots and quantification of FUNDC1:ACTA1 in WT and POLG CPCs (n = 4). (e) Representative western blots and quantification of BNIP3L:ACTA1 in WT and POLG CPCs (n = 4). Data are mean ± SEM. *p < 0.05; **p < 0.01; ***p < 0.001; n.s., not significant.