
Figure 7.
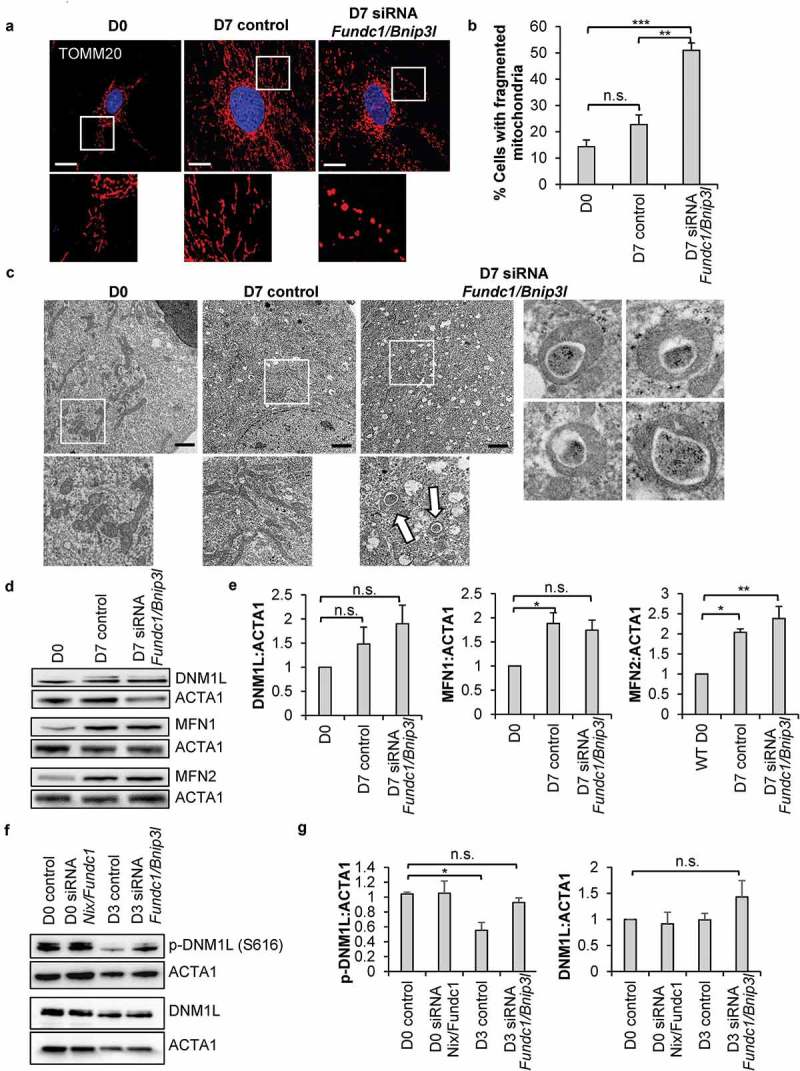
Knockdown of mitophagy receptors leads to formation of a fragmented mitochondrial network. (a) Representative fluorescence images of mitochondrial network in CPCs before and after incubation in DM. Scale bar: 20 μm. (b) Quantification of CPCs with fragmented mitochondria (n = 3). (c) Representative electron microscopy images of mitochondria in CPCs before and after incubation in DM. Arrows point to donut-shaped mitochondria. Scale bar: 2 μm. (d) Representative western blots of DNM1L, MFN1 and MFN2. (e) Quantification of DNM1L (n = 5), MFN1 (n = 3) and MFN2 (n = 3) protein levels. (f) Representative western blots of p-DNM1L (Ser 616) and DNM1L. (g) Quantification of p-DNM1L (n = 3) and DNM1L (n = 3) protein levels. Data are mean ± SEM. *p < 0.05; **p < 0.01; ***p < 0.001; n.s. not significant.