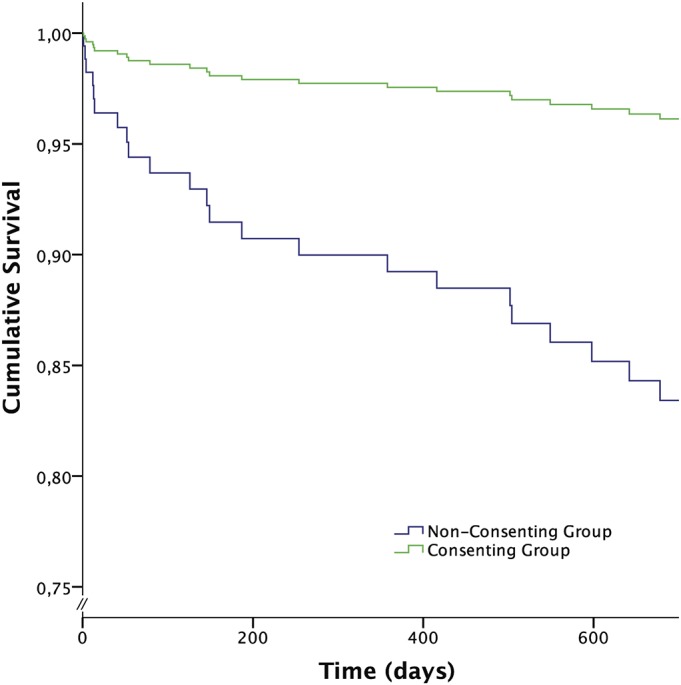
Fig. 2.

Cox proportional hazards regression for survival in the different groups, adjusted for age, sex, ASA category, and type of surgery.

Cox proportional hazards regression for survival in the different groups, adjusted for age, sex, ASA category, and type of surgery.