
Fig. 2-A.
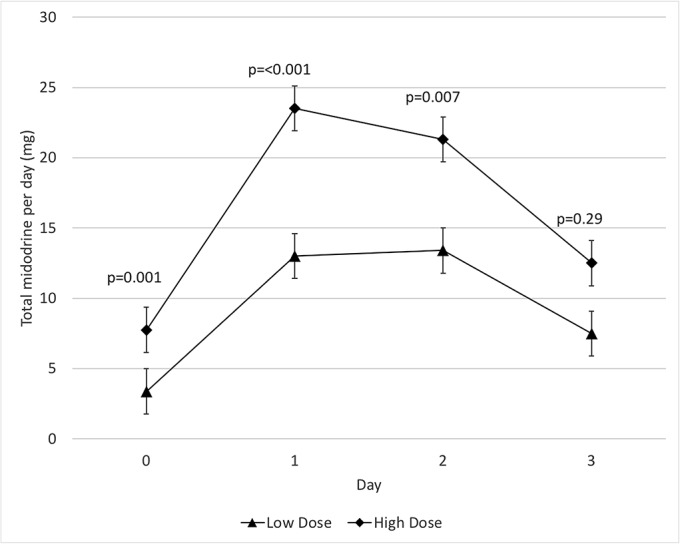
Mean total midodrine administration and 95% confidence interval.
Fig. 2-B.
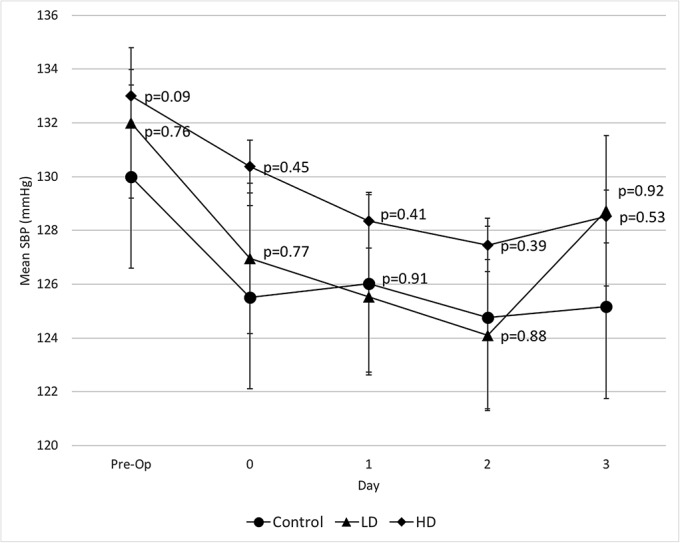
Mean systolic blood pressure (SBP) and 95% confidence interval. The p values on the higher-dose (HD) data points pertain to the comparison between the higher-dose and low-dose (LD) groups, and the p values on the low-dose data points pertain to the comparison between the low-dose group and the control group.
Fig. 2-C.

Mean lowest systolic blood pressure (SBP) and 95% confidence interval. The p values on the higher-dose (HD) data points pertain to the comparison between the higher-dose and low-dose (LD) groups, and the p values on the low-dose data points pertain to the comparison between the low-dose group and the control group.
Fig. 2-D.
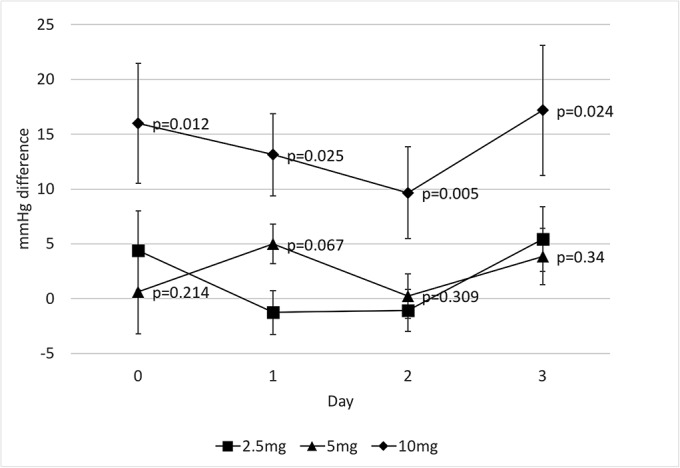
Mean difference in systolic blood pressure 2 hours post midodrine administration and 95% confidence interval. The p values on the 10-mg data points pertain to the comparison between 10 and 5 mg, and the p values on the 5-mg data points pertain to the comparison between 5 and 2.5 mg.