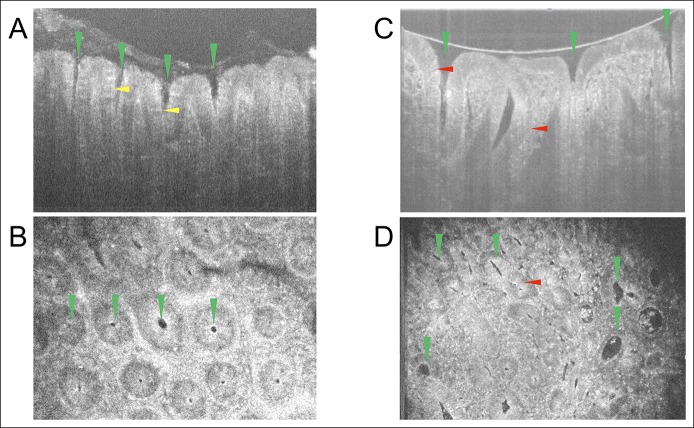
Figure 3.
Cross-sectional and en face images of polyps. (a) Representative cross-sectional micro-optical coherence tomography image of a hyperplastic polyp. (b) Representative en face image of the hyperplastic polyp shown in a. (c) Representative cross-sectional optical coherence tomography image of an adenoma. (d) Representative en face image of the adenoma shown in c. Green triangle: crypt lumen structure. Yellow triangle: goblet cells. Red triangle: nuclei.

