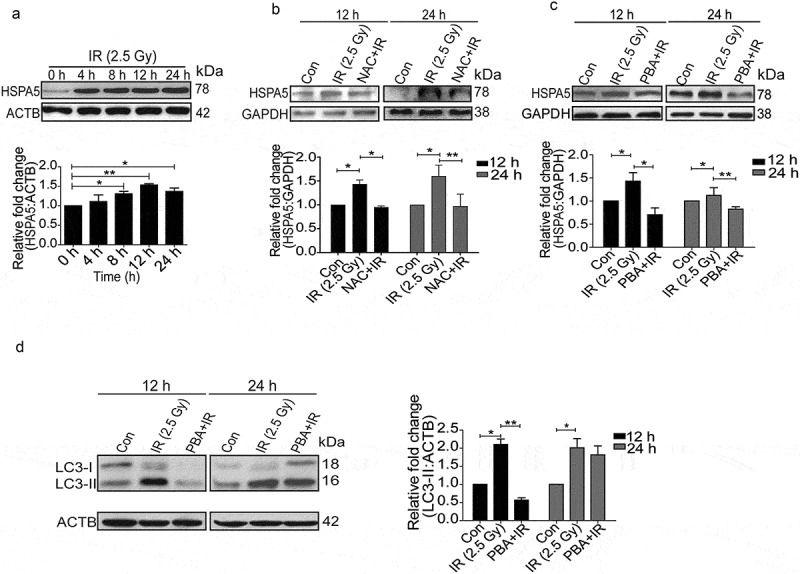
Figure 3.

Radiation induces ER stress in RAW 264.7 cells. (a) Kinetics of UPR induction after radiation exposure was studied through the expression profile of the UPR marker, HSPA5. The experiment was performed at least 3 independent times. The graph shows quantification of band intensities (relative to ACTB) from 3 independent experiments. (b) Immunoblots of total protein isolated from control, IR and NAC+IR samples at 12 or 24 h post-irradiation for analysing HSPA5 expression. NAC treatment was given 1 h prior to radiation followed by IR exposure. Blots were probed with the indicated specific antibodies. Each blot is representative of 3 independent experiments. The graph shows quantification of band intensities (relative to GAPDH) from 3 independent experiments. (c) Western blot analysis of UPR marker HSPA5 in cell lysate obtained from RAW 264.7 cells irradiated in the presence of the UPR inhibitor 4-PBA (3.5 mM). The data shown are representative of at least 3 separate experiments. The graph shows quantification of band intensities (relative to GAPDH) from 3 independent experiments. (d) LC3 levels were analyzed in the samples treated with 4-PBA. The graph shows quantification of band intensities (relative to ACTB) from 3 independent experiments.
