
Figure 2.
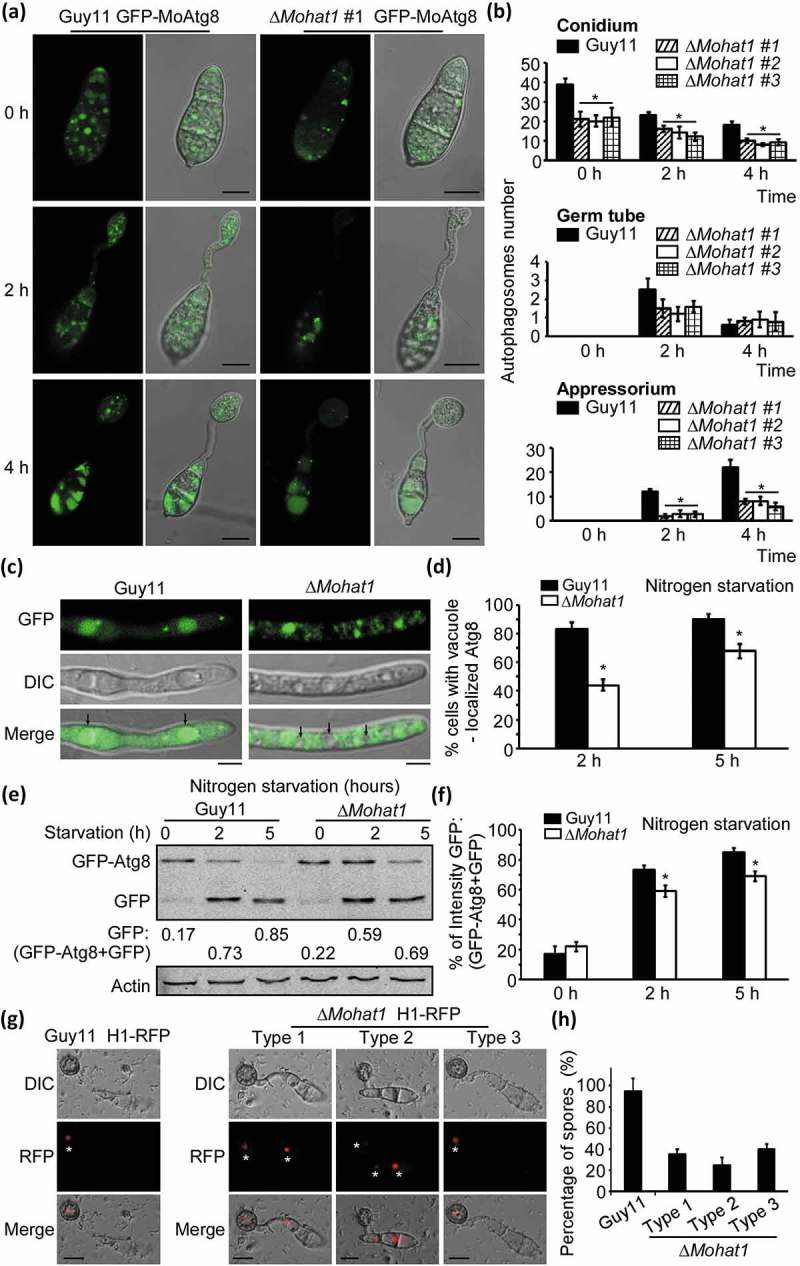
MoHat1 is involved in autophagy. (a) Cellular location of APs during infection-related appressorium development. Conidia were from both wild-type Guy11 and ∆Mohat1 mutant expressing GFP-MoATG8 gene fusion, inoculated onto hydrophobic interface and observed by epifluorescence microscopy at different times (scale bar: 10 μm. (b) Bar chart showing mean AP numbers present in conidia, germ tube and appressorium at 0, 2 and 4 h after germination. Three ∆Mohat1 transformants expressing GFP-MoATG8 gene fusion (∆Mohat1 #1, #2, #3) were used for statistical analysis. Error bars represent SD and asterisks represent significant differences (P < 0.01). (c) The Guy11 (WT) and ∆Mohat1 mutant strains transformed with GFP-MoAtg8 were cultured in MM-N (nitrogen starvation minimal medium) for 2 h, and the autophagy intensity was observed by Axio Observer A1 Zeiss inverted microscope. The arrow points to the vacuole. Scale bar: 5 μm. (d) Autophagy intensity was assessed by means of translocation of GFP-MoAtg8 into vacuoles (n = 100). Bars with asterisks represent significant differences (Duncan’s new multiple range method p < 0.01). (e and f) Immunoblotting was performed with anti-GFP and anti-Actin antibodies. The extent of autophagy was estimated by calculating the amount of free GFP compared with the total amount of intact GFP-Atg8 and free GFP (the numbers underneath the blot). (g) Spores of Guy11 H1-RFP and ∆Mohat1 H1-RFP strains were inoculated at a concentration of 5 × 10⁴ spores/ml onto artificial hydrophobic surfaces and imaged by Axio Observer A1 Zeiss inverted microscope at 24 hpi. Asterisks indicate the nucleus. Scale bar: 10 μm. (h) Percentage of spores containing different number of nuclei in both Guy11 H1-RFP and ∆Mohat1 H1-RFP strains. Mean values were calculated from three independent replicates by counting the nuclei from 100 spores per strain for each replicate. Error bars are standard deviation.