Figure 1.

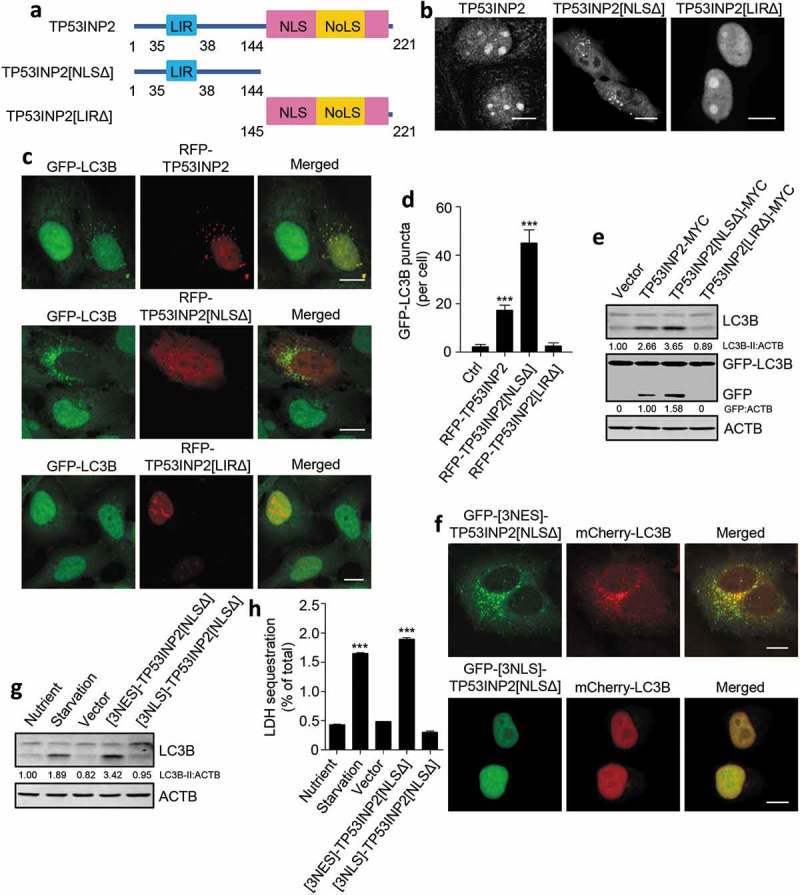
Cytoplasmic TP53INP2 stimulates autophagy. (a) Domain architecture of TP53INP2, TP53INP2[NLSΔ] and TP53INP2[LIRΔ]. LIR, LC3-interacting region; NLS, nuclear localization signal; NoLS, nucleolar localization signal. (b) The intracellular distribution of GFP-tagged TP53INP2, TP53INP2[NLSΔ] or TP53INP2[LIRΔ] in HeLa cells. (c) Confocal images of HEK293 cells stably expressing GFP-LC3B with RFP-tagged TP53INP2, TP53INP2[NLSΔ] or TP53INP2[LIRΔ] transfection. (d) Quantification of GFP-LC3B puncta in (c). The data are presented as mean ± SEM, n = 30 cells. (e) Western blot analysis of LC3B-II production and GFP-LC3B cleavage in HEK293 cells stably expressing GFP-LC3B and transfected with the indicated plasmids. (f) Confocal images of HEK293 cells stably expressing mCherry-LC3B and transfected with plasmids expressing GFP-[3NES]-TP53INP2[NLSΔ] or GFP-[3NLS]-TP53INP2[NLSΔ]. (g) Western blot analysis of intracellular LC3B in HEK293 cells that were starved or transfected with the GFP-tagged indicated plasmids. (h) LDH sequestration assay of HEK293 cells treated as in (g) in the presence of chloroquine. The data are presented as mean ± SEM of triplicates. ***, P < 0.001. Scale bars: 10 µm.
