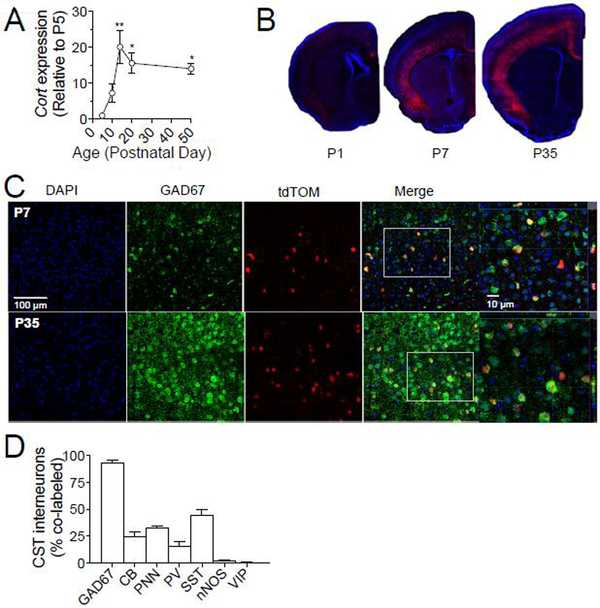
Fig. 2. Developmental expression of Cort and co-expression of CST interneurons with interneuron markers.
(A) qPCR demonstrates the time course of cortical Cort expression across development, which peaks in the second and third postnatal weeks (1-way ANOVA, p=0.0055, post-hoc t-tests, P5:P14-p<0.001, P5:P20 and P5:P50, p<0.05). Data is represented as fold changed relative to P5. (B) Representative images depicting cortical expression of tdTomato (tdTOM) labeled CST-interneurons across early postnatal development. (C) Representative images demonstrating co-labeling of tdTOM labeled CST interneurons and inhibitory enzyme Glutamate decarboxylase 67 (GAD67) at P7 and P35. (D) Percent co-labeling of tdTOM labeled CST interneurons in somatosensory cortex (S1) of 6 week old mice (n=3). Data are represented as mean ± SEM (*p<0.05, **p<0.01).

