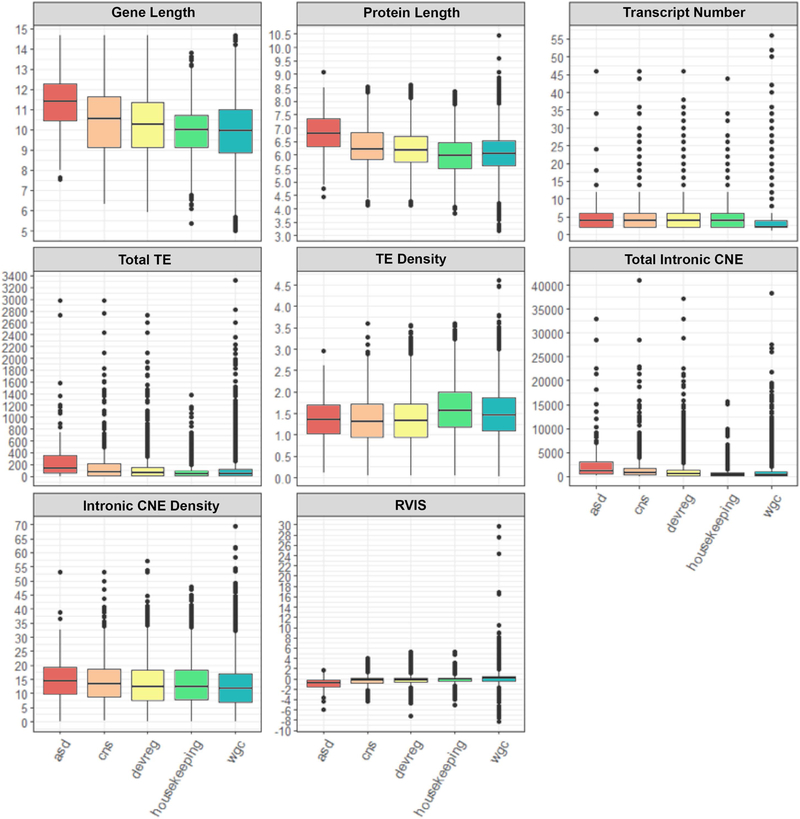
Figure 1.
Boxplots illustrating the distribution for variables of interest across the different gene groups. (Gene and protein lengths represent the logarithmic value rather than absolute lengths.) Abbreviations: autism spectrum disorder (ASD), central nervous system (CNS), developmental regulatory (devreg), whole genome control (WGC), transposable elements (TE), conserved noncoding elements (CNE), residual variance intolerance score (RVIS).

