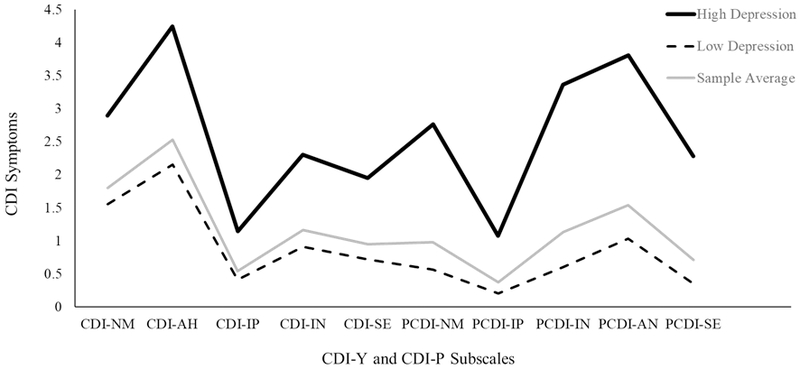
Figure 1.

Means for each of the subscales on the CDI-Y and CDI-P for our two profiles identified in our latent profile analyses. The sample average for each subscale is also displayed to provide context for the profiles. For the “High Depression” profile (N=129; 19% of the sample), individuals were classified in the correct profile 96% of the time. For the “Low Depression (N=550; 81% of the sample) individuals were classified in the correct profile 99% of the time.
