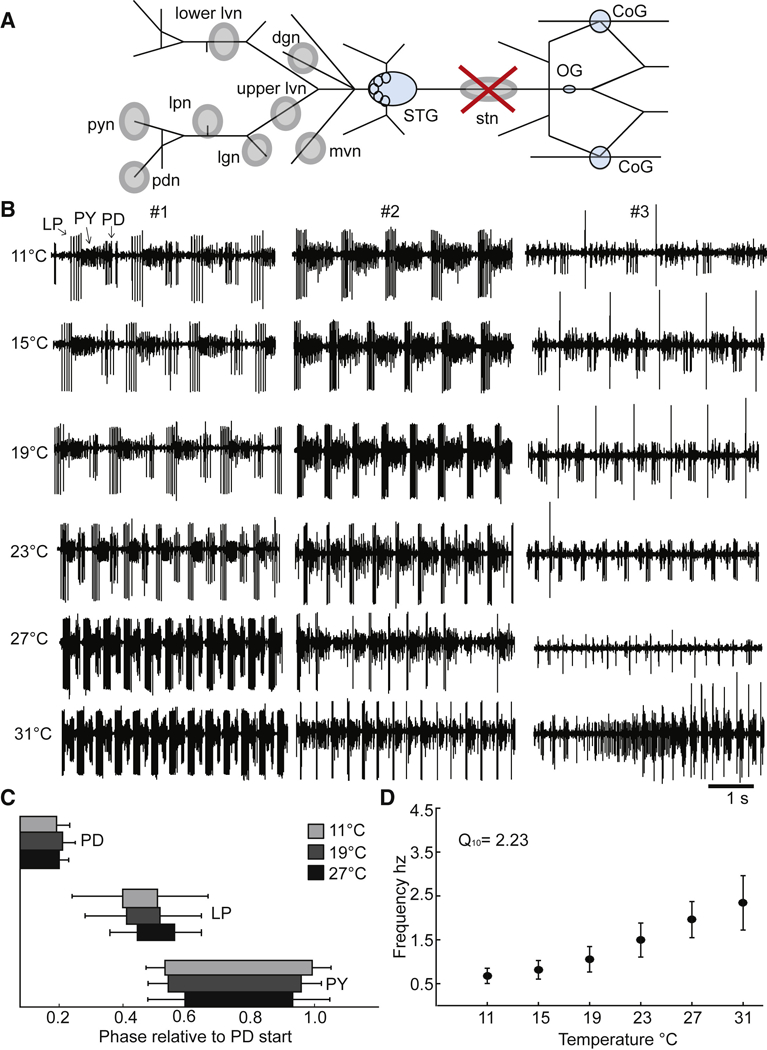
Figure 1.

Recording configuration and control data from decentralized preparations. A. Simplified diagram of the STNS as it would appear dissected and pinned out onto a Sylgard coated petri dish. The Stomatogastric Ganglion (STG), Commissural Ganglia (CoGs) and Esophageal Ganglion (OG) are colored light blue. Grey circles indicate where Vaseline wells are made around nerves of interest for extracellular recordings. The stn (stomatogastric nerve) well with the large red ‘X” indicates where the stn is cut for decentralization after the well surrounding the stn had been filled with TTX and sucrose to silence the nerve. All the other wells, which fall posterior (left on diagram) to the STG, indicate the nerves where extracellular recordings were made. B. Five seconds of raw extracellular traces from the lvn from three different decentralized preparations (#1, #2, #3), at 11°C, 15°C, 19°C, 23°C, 27°C and 31°C. The activity shown from these preparations represents the variety of activity seen in the decentralized condition across temperature. C. The average phase relationships of the neurons that generate the triphasic rhythm for three temperatures, 11°C (light grey), 19°C (dark grey) and 27°C (black). The phase is calculated relative to the start of the PD burst per cycle. The bars represent the standard deviation of the data. Only preparations with a triphasic rhythm are included in these plots. (N@11=24, @15=24, @19=25, @23=23, @27=18, @31=11). D. The mean frequency of the rhythm calculated from the activity of the PD neurons, across temperature. The bars represent the standard deviation of the data. Only preparations with rhythmic PD bursts are included in this plot. (N@11=24, @15=24, @19=25, @23=24, @27=19, @31=14).
