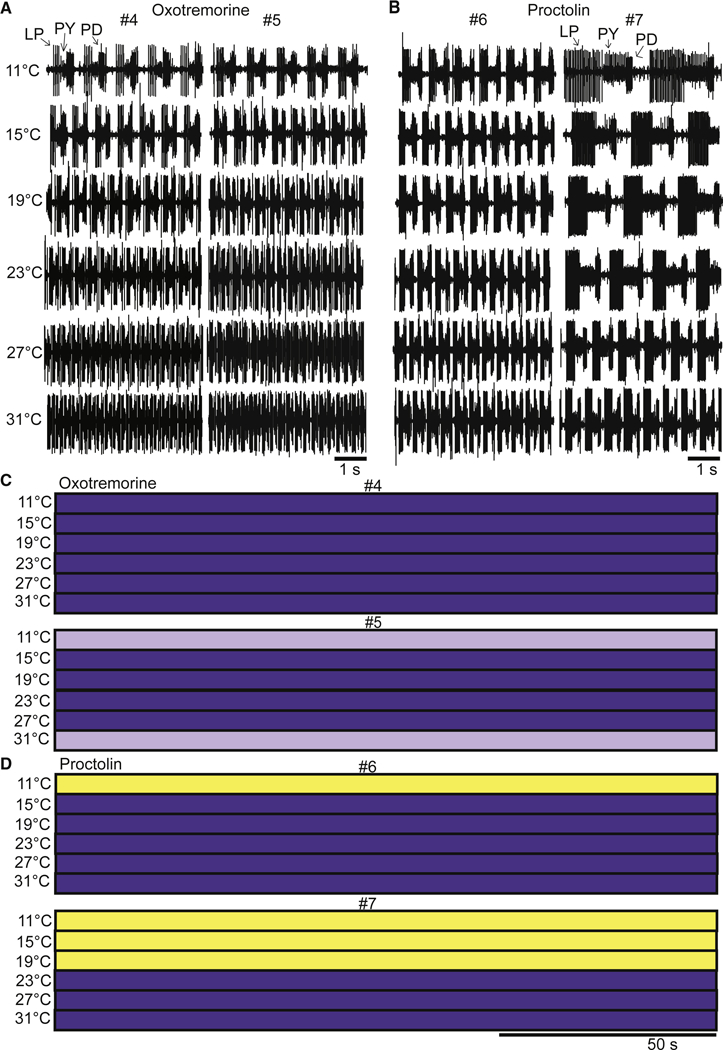
Figure 4.

The effects of oxotremorine and proctolin as a function of temperature. A. Example raw traces from two different preparations (#4 and #5) in 10−5 M oxotremorine at each temperature. B. Example raw traces from two different preparations (#6 and #7) in 10−6 M proctolin at each temperature. C. The activity of the same preparations (#4 and #5) from panel A across the entire 150 s file as a function of temperature. D. The activity of the same preparations (#6 and #7) from panel B across the entire 150 s file as a function of temperature.
