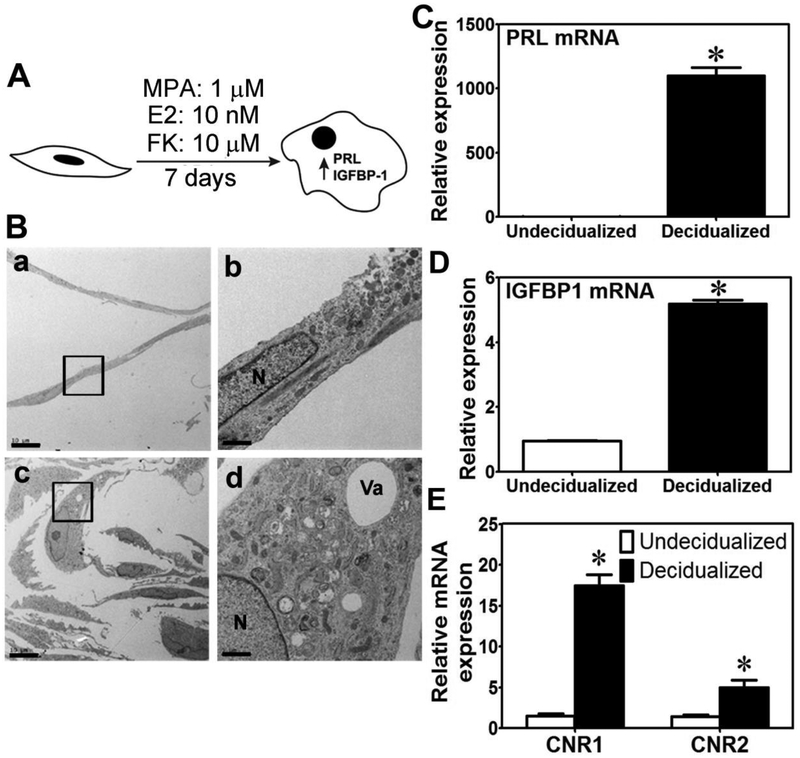
Figure 1. Decidualization of THESCs using FK.
A. A schematic representation of THESC decidualization using the MEF treatment. MPA, E2 and FK represent medroxyprogesterone acetate, β-estradiol and forskolin, respectively. B. TEM images a and b show that undecidualized THESCs are narrow with a small nucleus. TEM images c and d indicate that decidualized THESCs have larger cytoplasmic and nuclear volume and that the cytoplasm is enriched with mitochondria, endoplasmic reticulum, vacuoles and vesicles. Boxs in images a and c are magnified in b and d, respectively. The scale bars in images a and c represent 10 μm. The scale bars in images b and d represent 2 μm. N and Va in image d represent nucleus and vacuole, respectively. C and D show that MEF treatments induced THSEC decidualization which is associated with a robust increase in mRNA expression of PRL and IGFBP-1, respectively. *indicates a p value of ≤ 0.05 between undecidualized and decidualized THESCs. E shows that decidualizing THESCs for 7 day leads to a significant increase in mRNA expression of both CNR1 and CNR2. *indicates a p value of ≤ 0.05 between decidualized and undecidualized cells.

