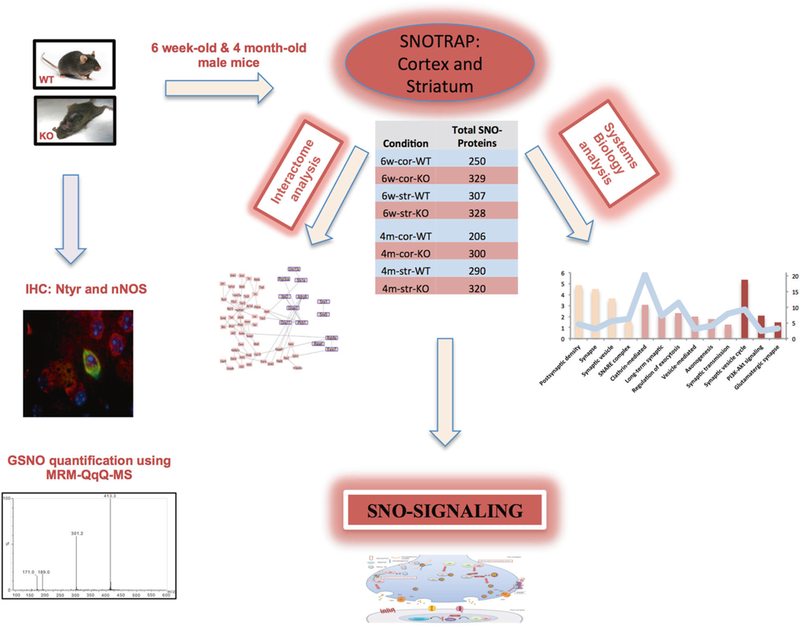
Fig. 1.

Schematic describes the steps done in this study. SNOTRAP sample preparation was conducted to identify SNO-proteins in the cortex and striatum of 6 week- and 4 month-old mice in both WT and InsG3680(+/+) (KO) groups. Each SNO-proteins set shown in the table was analyzed by GO, KEGG pathway and STRING protein–protein interactions. WB and IHC were conducted to validate SNO-signaling mechanisms. IHC was performed to identify differences in 3-Nitrotyrosine in 6 different regions of the cortex and striatum. Using an LC–MS quantitative method, we analyzed GSNO concentrations in all WT and KO samples. nNOS expression levels were measured by WB. nNOS co-localization with NeuN was examined
