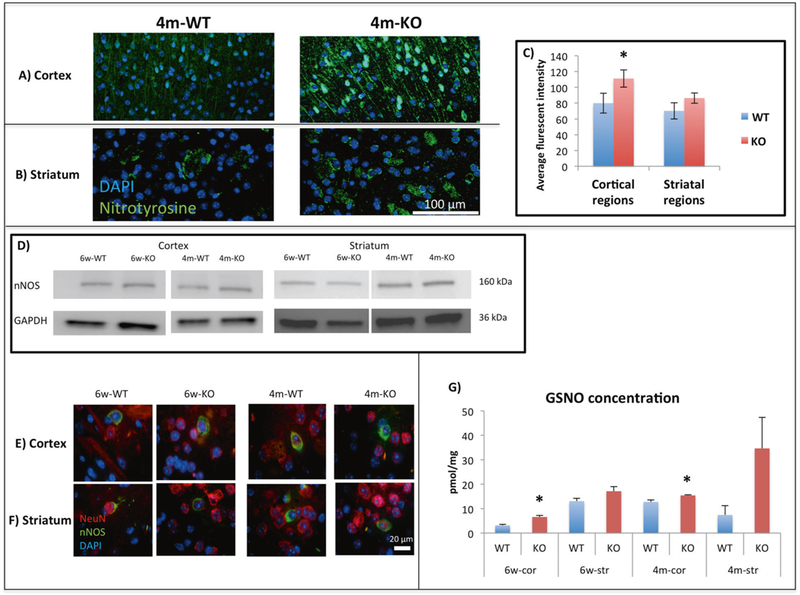
Fig. 4.

Representative staining of 3-nitrotyrosine (green) and DAPI (blue) for (a) Cortex and for (b) Striatum in 4m-WT and 4m-KO groups. c The average fluorescent intensity of 3-nitrotyrosine comparing 4m-WT to 4m-KO of the cortical regions (prefrontal cortex, motor cortex and somatosensory cortex) and striatal regions (central, medial, and lateral striatum). Significant increase was found in 4m-cor-KO compared to 4m-cor-WT. An increase was found in 4m-str-KO compared to 4m-str-WT. Presented as mean and ±SEM. One tailed t-test was conducted. *P < 0.05, WT mice (n = 9) and KO mice (n = 9). d Representative WB (for nNOS) from cortex and striatum tissues prepared from 6w-WT, 6w-KO, 4m-WT, and 4m-KO. See Supplementary Figure 9 for quantification. e Representative staining of the co-localization of nNOS (green), neurons (NeuN) (red), and DAPI (blue) in the cortex and f striatum of 6w-WT, 6w-KO, 4m-WT, and 4m-KO. g GSNO concentration of the 8 different tested groups. The multiple reaction monitoring (MRM) mode of a Triple Quadrupole mass spectrometer (QqQ MS) was used to establish a sensitive and selective quantification method. Y axis represents the concentration of GSNO in pmol/mg protein. Significant increase in the cor-KO compared to the cor-WT groups. Increase in the str-KO compared to the str-WT groups. Presented as mean and ±SEM. One tailed t-test was conducted. *P < 0.05, WT mice (n = 3) and KO mice (n = 3)
