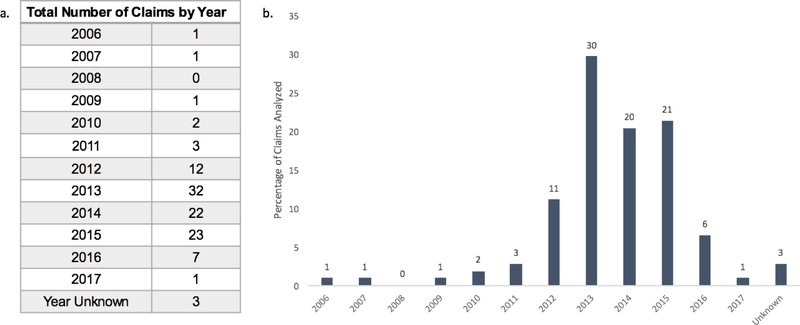
Figure 2: Claims filed against Intuitive Surgical, Inc. by year (a) and as a percentage of claims analyzed (b).
There were 0–3 claims filed each year from 2006–2011. A peak in claims was seen in 2013–2015, with 32 claims (30%) filed in 2013, 22 claims (20%) filed in 2014, and 23 claims (21%) filed in 2015. The number of claims decreased substantially in 2016 and further in 2017, despite an increase in the total number of robotic cases performed annually using Intuitive Surgical, Inc. devices.

