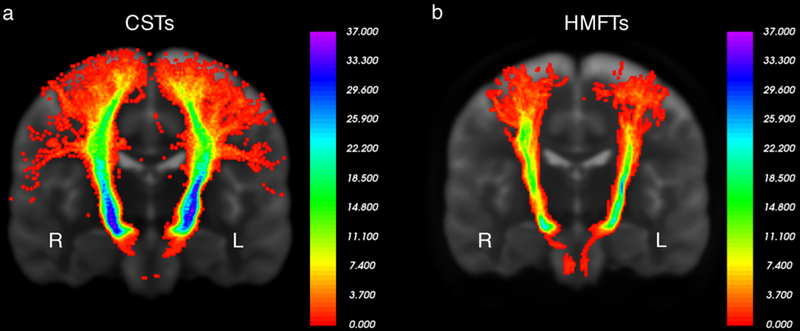
Fig. 6.
a Variability probabilistic heat map of the corticospinal tract (CST) in our 37 Washington University (WashU) healthy human subjects in the coronal plane. As indicated by the scale in the image, all or nearly all of our subjects had CST fibers passing from areas adjacent to the regions of interest (ROIs), with more variability in the cortical projections. Left is labeled as L and right as R.
b Variability probabilistic heat map of hand-related motor fiber tracts (HMFTs) in our 37 WashU healthy human subjects in the coronal plane. Left is labeled as L and right as R. Despite the use of the same methodology on state-of-the-art data, the difference in variability is noticeable, potentially indicating limitations of the current tools in diffusion tensor imaging (DTI) image analysis.

