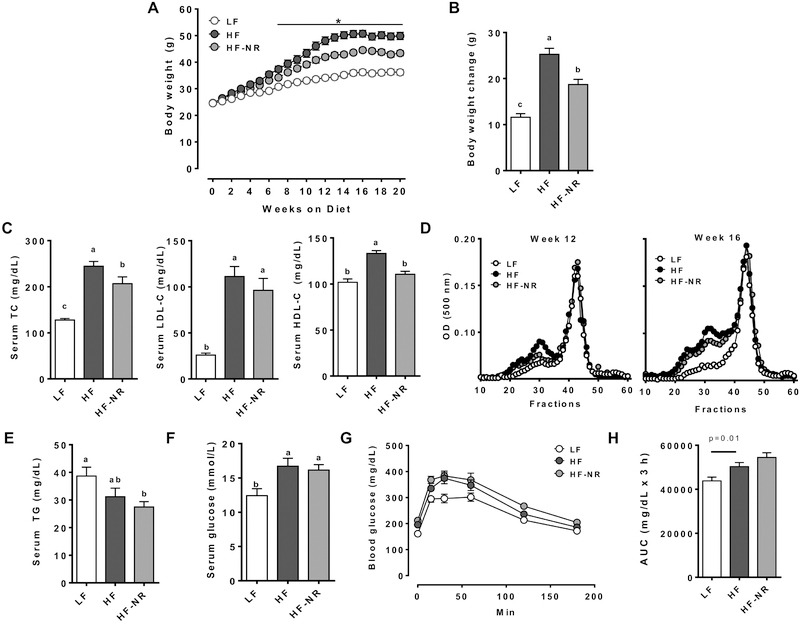
Figure 1.
NR supplementation lowered body weight and led to a more favorable lipid profile, but did not improve glucose tolerance. A) Body weight of mice through 20 weeks of experimental diets. B) Body weight change. C) Serum total cholesterol, LDL-cholesterol, HDL-cholesterol. D) Lipoprotein profile of pooled plasma of mice from each group. E) Serum triglycerides. F) Serum glucose. G) Oral glucose tolerance test. H) Area under the curve of OGTT. n =13–15 per group. Data shown are mean ± SEM. Bars with different letters are significantly differently from each other. * indicates significantly different between HF and HF-NR. (p < 0.05)

