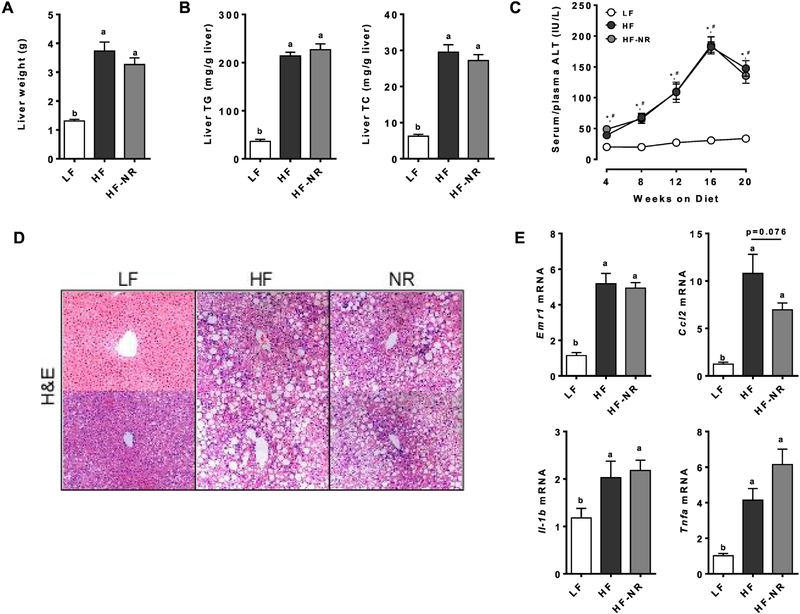
Figure 2.
NR did not reduce TG and TC accumulation or inflammation in the liver. A) Liver weight. B) Liver triglyceride and total cholesterol. C) Plasma ALT at wk 4–16 and serum ALT at wk 20. * significance between LF and HF, # indicates significance between LF and HF-NR. D) Representative picture of hematoxylin and eosin (H&E) staining of liver sections from 2 different mice in each group. E) Liver mRNA expression of inflammatory genes. n =13–15 per group. Data shown are mean ± SEM. Bars with different letters are significantly different from each other. (p < 0.05)

