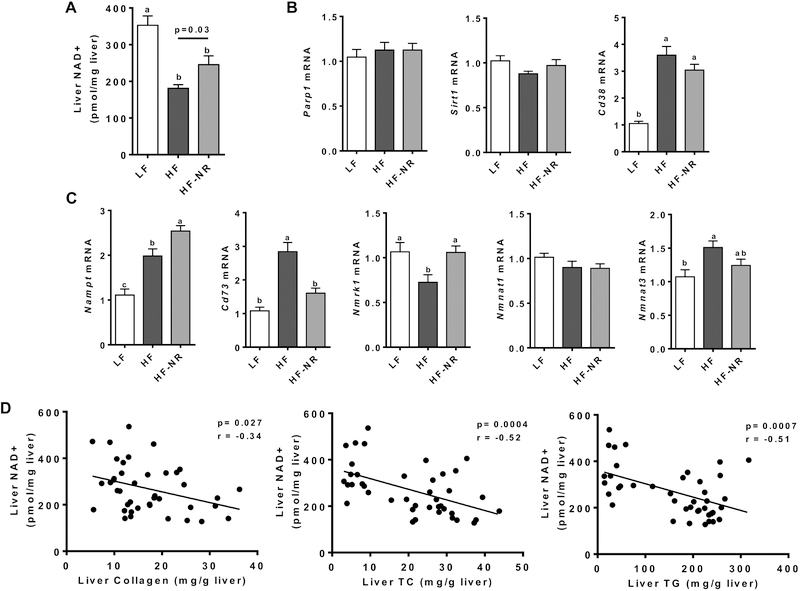
Figure 4.
HF altered liver NAD+ metabolism which is attenuated by NR supplementation. A) Quantification of liver NAD+ by enzyme cycling assay. B) Liver mRNA expression of known NAD+ consuming enzymes. C) Liver mRNA expression of genes involved in the NAD+ salvage pathway. D) Correlation analysis of liver NAD+ concentration with liver collagen, total cholesterol, and triglycerides. n =13–15 per group. Data shown are mean ± SEM. Bars with different letters are significantly different from each other. (p < 0.05)

