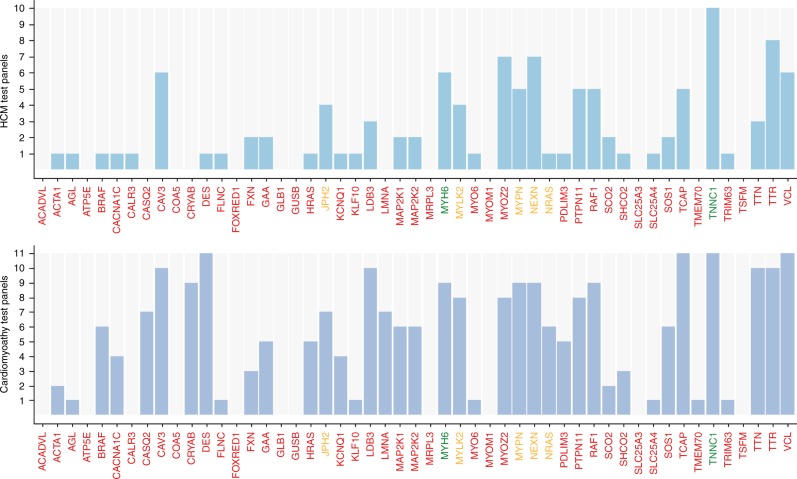
Fig. 1.
Frequency of the 51 selected candidate genes in current commercial test panels. All genes listed in the Genomics England hypertrophic cardiomyopathy (HCM) panel that were not in the Oxford Medical Genetics Laboratory (OMGL) clinical HCM test panel at the time of this study were selected for analysis. The bar chart displays the number of times each of the 51 selected candidate genes was included in a commercial test panel. Data was extracted from the National Center for Biotechnology Information (NCBI) Gene Tests website (October 2016) and Genetic Test Registry (December 2017). This included 10 clinical HCM panels and 11 clinical cardiomyopathy panels. Information on laboratories and available test panels is in Table S5. The gene labels are colored according to the review status as annotated by Genomics England, which gives an indication of the level of evidence supporting each gene–disease relationship: Green = high evidence, the gene is very likely be the cause of the disease and can be reported back to patients. Amber = moderate evidence, and should not yet be used for genome interpretation. Red = low evidence for a role in disease, or not suitable for clinical diagnosis at this time.

