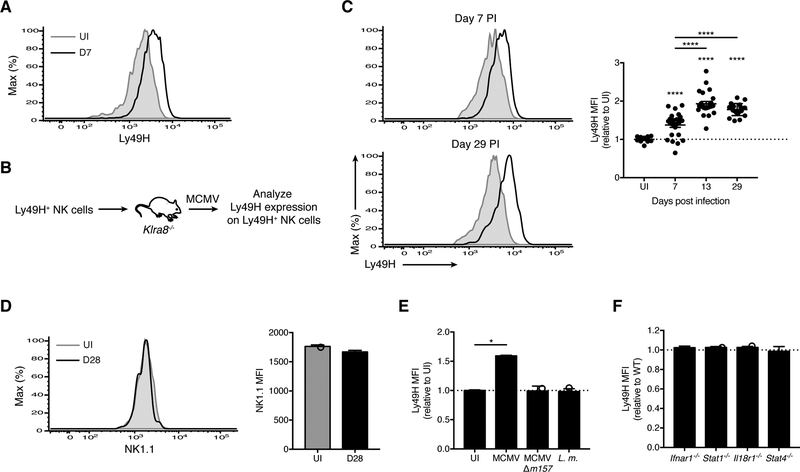
Figure 1. MCMV-driven changes in Ly49H expression within the antiviral NK cell pool are m157-dependent.
(A) Histograms of Ly49H expression on splenic Ly49H+ NK cells (gating strategy in Figure S1A) from uninfected (UI) and MCMV-infected WT mice at day 7 PI (D7). Data are representative of at least five independent experiments with 5–10 mice per experiment.
(B-C) Experimental schematic (B). Ly49H+ NK cells were transferred into Klra8−/− mice, and their phenotype analyzed following MCMV infection of the recipients. (C) Histograms of Ly49H expression on Ly49H+ NK cells from blood of UI WT mice (shaded gray) versus at day 7 PI (top left) and day 29 PI (bottom left) (black lines). Quantification of Ly49H median fluorescence intensity (MFI) on Ly49H+ NK cells at indicated days PI relative to UI WT mice bled on the same day (right). Data are representative of three independent experiments with 10–25 mice per experiment.
(D) As in (C), histograms (left) and MFI (right) of NK1.1 on Ly49H+ NK cells from blood of UI WT mice and at day 28 PI. Data are representative of at least three independent experiments with 3–9 mice per experiment.
(E) WT mice were infected with MCMV, MCMV-Δm157, Listeria monocytogenes (L.m.) or UI. Data is represented as Ly49H MFI on Ly49H+ NK cells from blood at day 7 PI for indicated infections relative to UI. Data are representative of two independent experiments with 2–5 mice per group.
(F) As in (B), except splenocytes from WT and indicated knock-out (KO) mice were co-transferred. Data is represented as Ly49H MFI on KO Ly49H+ NK cells relative to WT from blood at day 7 PI. Data are representative of two to four independent experiments with 2–5 mice per group. Groups with a ratio < 1 were compared against 1 using a one sample t test.
Groups were compared using an unpaired, two-tailed Student’s t test (D) or against 1 using a one sample t test (E). In (C), each timepoint was compared against 1 using a one sample t test, and against each other using a paired two-tailed t test. Data are presented as the mean ± SEM. *p < 0.05; ****p < 0.0001. See also Figure S1.

