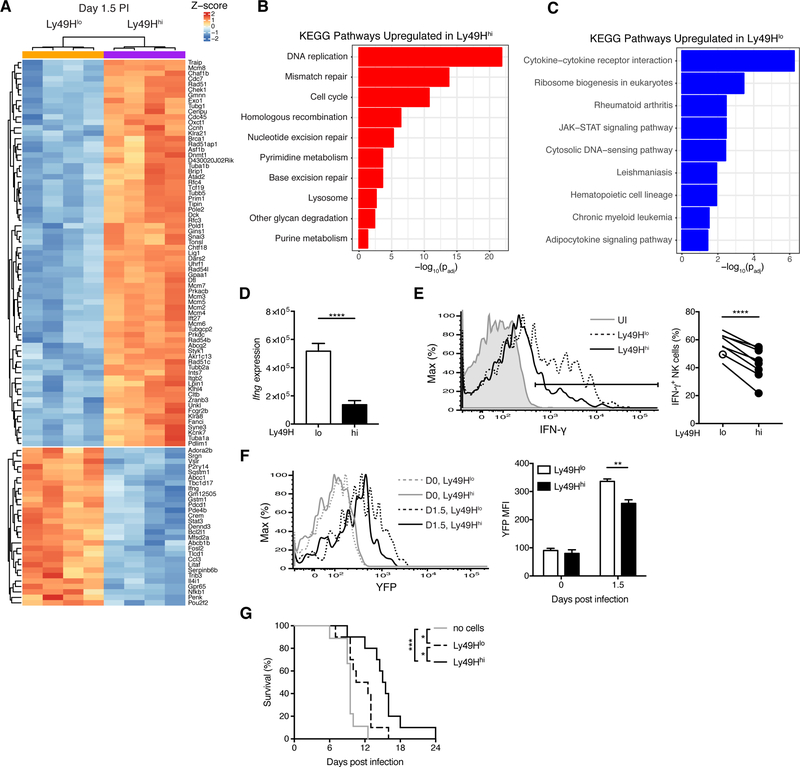
Figure 3. Ly49Hlo NK cells produce more IFN-γ during early MCMV infection.
(A-D) Splenic Ly49Hlo and Ly49Hhi NK cells were sorted for RNA-seq at day 1.5 PI (4 replicates each). (A) Heat map and hierarchical clustering of top 100 differentially expressed genes by p-value. (B-C) Gene ontology analysis of differential KEGG pathways for genes significantly (padj < 0.05) upregulated in Ly49Hhi NK cells (B) and upregulated in Ly49Hlo NK cells (C). Their respective p values are shown. (D) Quantification of RNA-seq reads mapping to the Ifng locus. P value was calculated in DESeq2 and adjusted for testing multiple hypotheses.
(E) Histograms of intracellular IFN-γ expression in splenic Ly49H+ NK cells from UI and MCMV-infected WT mice at day 1.5 PI (left). Quantification of percent IFN-γ+ NK cells within indicated NK cell populations (right). Data are representative of at least five independent experiments with 3–15 mice per experiment.
(F) As in (E), except UI or MCMV-infected Ifng-IRES-YFP mice at day 1.5 PI. Histograms (left) and quantification of YFP MFI (right) before and after MCMV infection. Data are representative of two independent experiments with 2–3 mice per time point per experiment.
(G) Kaplan-Meier survival curves of Rag2−/− Il2rg−/− mice that received either no cells, 50,000 purified Ly49Hlo NK cells, or 50,000 purified Ly49Hhi NK cells 2 days prior to MCMV infection. Data are pooled from two independent experiments with 4–5 mice per group per experiment.
Groups were compared using a paired, two-tailed t test (E, F) or the Log-rank (Mantel-Cox) test with correction for testing multiple hypotheses (G). Data are presented as the mean ± SEM. *p < 0.05, **p < 0.01, ***p < 0.001, ****p < 0.0001. See also Figures S2 and S3 and Table S1.

