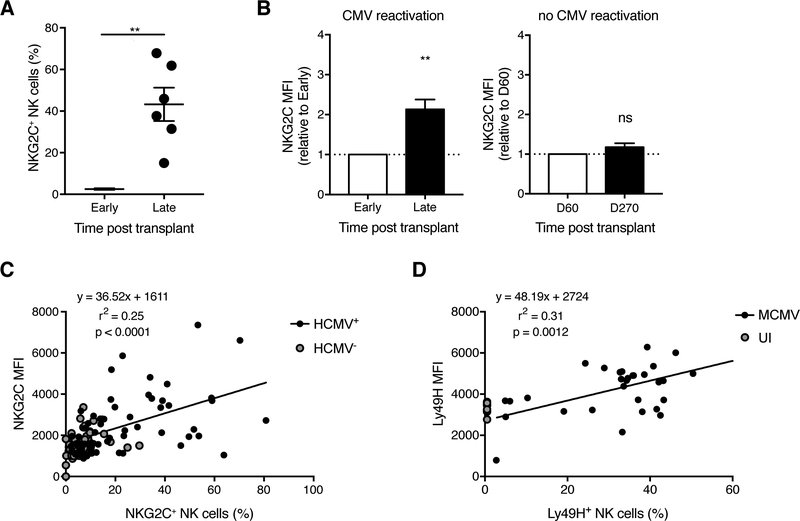
Figure 4. HCMV reactivation in HSCT recipients drives higher NKG2C expression on human NKG2C+ NK cells.
(A-B) Blood was drawn from T cell-depleted HSCT recipients in the year following transplant (every ~30–90 days). HCMV infection status was determined by viral qPCR. “Early” and “Late” are paired samples from the same HCMV-reactivating transplant recipients. “Early” refers to 15–60 days post transplant depending on the recipient, and “Late” includes the window between 200 days to 1 year post transplant. The data are presented as such to synchronize the timing of adaptive NKG2C+ NK cell appearance, which was recipient-dependent. It was expansion of the NKG2C+ NK cell population that dictated the observed kinetic profile of NKG2C MFI. (A) Percentage of NKG2C+ NK cells among CD3−CD56+ cells (gating strategy in Figure S4). (B) Quantification of NKG2C MFI on NKG2C+ NK cells from transplant recipients who reactivated (left) or did not reactivate (right) HCMV. Groups were compared using a paired, two-tailed t test (A) or against 1 using a one sample t test (B). Data are presented as the mean ± SEM. ns, not significant; **p < 0.01.
(C) Blood was drawn from healthy HCMV-seropositive and HCMV-seronegative donors. Correlation between NKG2C MFI and percentage of NKG2C+ NK cells. Linear regression was performed on HCMV+ samples. P value represents the likelihood of a non-zero slope.
(D) Experimental design as in Figure 1B. Correlation between Ly49H MFI and the Ly49H+ NK cell expansion (i.e. percentage of Ly49H+ NK cells among total NK cells) at day 7 PI. UI WT mice were assigned 0% expansion. Linear regression was performed on MCMV-infected samples. P value represents the likelihood of a non-zero slope.
See also Figure S4.

