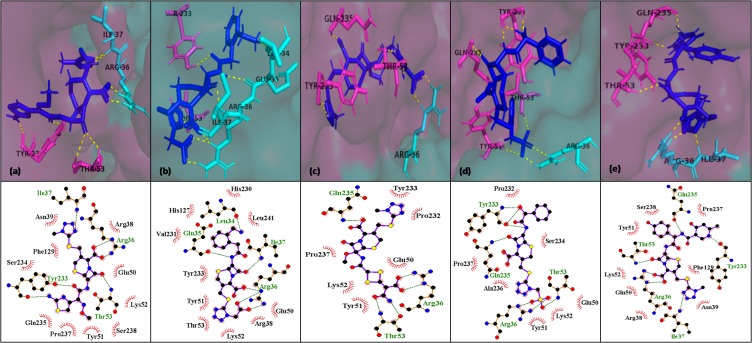
Figure 3.
Interaction of selected leads with binding site 2 after energy minimization, (a) cefmenoxime (b) ceforanide (c) cefotetan (d) cefonicid sodium and (e) cefpiramide. E1 chain of the binding site is shown as pink surface, E2 chain as cyan surface, their interacting residues as pink and cyan sticks respectively, whereas ligands as blue stick H-bonding with interacting residues as yellow dotted lines. Also, their interactions are displayed in pose view

