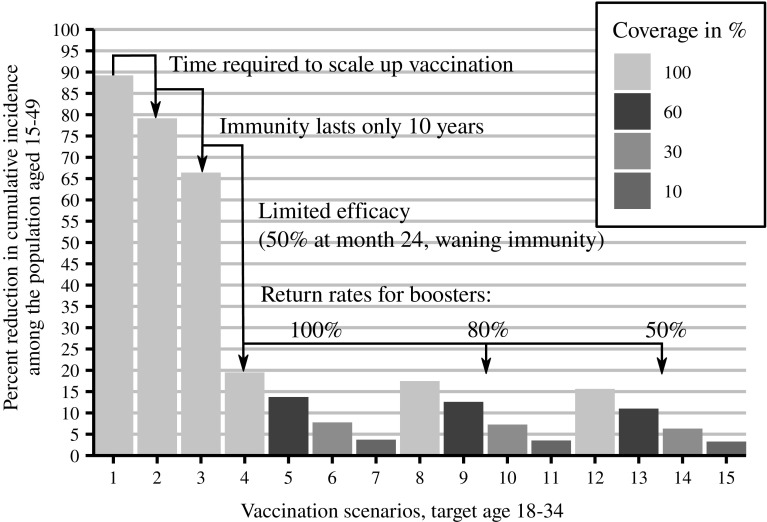
Fig. 1.
Percent reduction in cumulative new infections in a nested hierarchy of HIV vaccination scenarios. The percent values refer to the cumulative number of infections prevented by vaccination in South Africa between 2027 and 2047 in populations aged 15–49, divided by the cumulative number of infections in non-vaccine reference simulations for the same time period and age range

