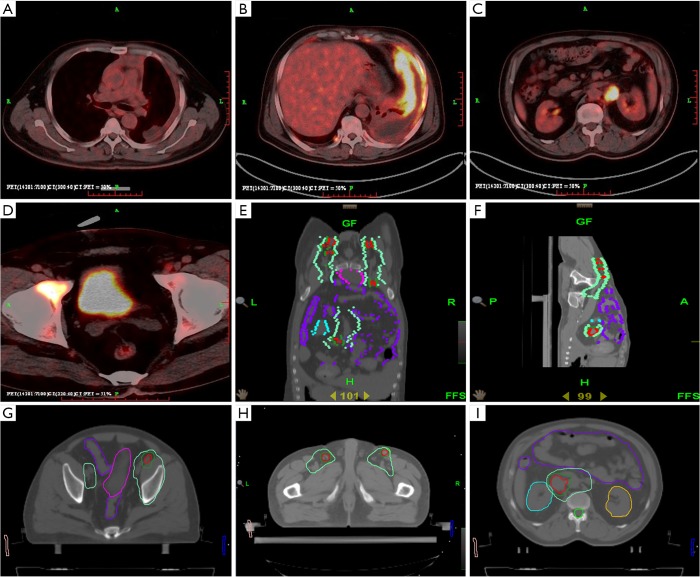
Figure 2.
PET-CT reexamination images after the first radiotherapy and before TOMO therapy. (A) This mainly shows anterior mediastinal occupation and no significant increase in FDG metabolism, suggesting that after radiotherapy on the primary thymus lesion, the tumor was inactive. The shrunken mass also indicates the effectiveness of local radiotherapy. (B) Left pleura thickening, (C) retroperitoneal multiple lymphadenectasis, and (D) the right acetabulum showed an abnormal increase in FDG metabolism; metastasis was considered. TOMO schedule chart. (E) and (F) are systemic figures of the TOMO schedule, showing the whole radiotherapy target volume which included the (G) acetabulum, (H) inguinal lymph nodes, and (I) abdominal lymph nodes. TOMO, tomotherapy.

