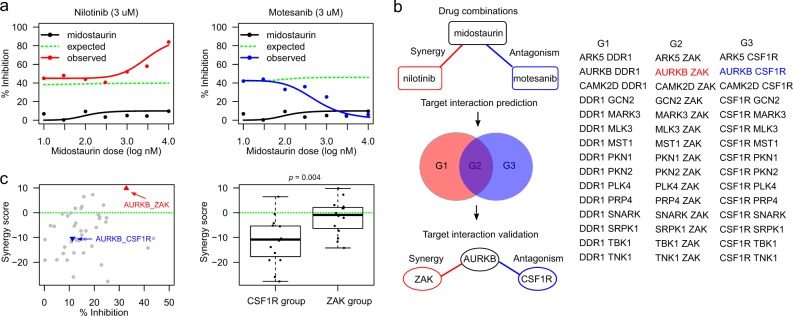
Fig. 2.
Identification of synergistic and antagonistic target interactions behind drug combinations. a Opposite drug combination effects for midostaurin–nilotinib (left panel) versus midostaurin–motesanib (right panel). Motesanib alone produced a minimal effect on cell viability (black curves). In the pairwise combinations, 3 µM nilotinib or motesanib was combined with midostaurin across seven concentrations, ranging from 10 to 10,000 nM. Compared to the reference dose-response curves of no synergy (green dotted lines), nilotinib potentiated midostaurin (red curve in the left panel), while motesanib antagonized midostaurin (blue curve in the right panel). b Identification of the target interactions behind the TIMMA-predicted midostaurin–nilotinib synergy and the midostaurin–motesanib antagonism. To explain the synergistic and antagonistic interactions, the possible target combinations were determined from the kinome-wide drug-target interactions21 and gene expression data,22 resulting in three groups of potential target pairs: Group 1 (G1) contains the target pairs that are unique to midostaurin–nilotinib combination. Group 2 (G2) contains the target pairs that are shared between midostaurin–nilotinib and midostaurin–motesanib combinations. Group 3 (G3) contains the target pairs that are unique to midostaurin–motesanib combination. A kinase was defined as target for a given drug if the dissociation constant (Kd) is lower than 10-fold of the minimal Kd across all the kinases for this drug. Further, non-expressed targets were removed if their log2 gene expression values were lower than 6 in MDA-MB-231 cells, according to the mRNA expression data from the Cancer Cell Line Encyclopedia.22 All the target pairs were profiled in-house using the double siRNA knock-down experiments, resulting in the identification of the synergistic and antagonistic target interactions. c Left panel: the percentage inhibition and synergy scores for the target interactions in the siRNA combination experiments. AURKB–ZAK interaction (red triangle) showed top synergy among all the target pairs (p < 0.001), while the AURKB–CSF1R interaction (blue triangle) showed strong antagonistic effects (p < 0.05). Right panel: the synergy scores for the target interactions involving CSF1R and ZAK separately (p < 0.01). The green dotted line shows the baselines of zero synergy. Statistical significance was evaluated using Wilcoxon rank sum test (two-sided)

