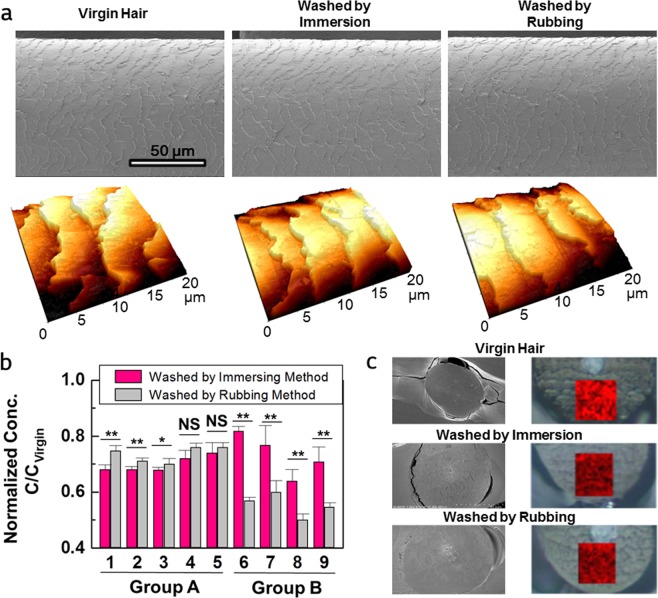
Figure 1.
Comparison of virgin hair, hair washed by the immersion method, and hair washed by the rubbing method. (a) SEM and AFM images of washed hairs. (b) Noncovalently bound hair lipid composition after washing with an SLES solution. The concentration of lipids extracted from washed hair was divided by that from virgin hair. The error bar amplitude indicates standard deviation. The lines above the bar graph denote a significant difference (n = 6) calculated using Student’s t-test. NS – not significant, *P < 0.05, and **P < 0.01. Graphs for the lipids in group A: 1. Myristic acid; 2. Palmitic acid; 3. Stearic acid; 4. Oleic acid; 5. Cholesterol. Graphs for the lipids in group B: 6. Squalene; 7. Myristyl palmitate; 8. Palmityl palmitate; 9. Stearyl palmitate. (c) Spatial verification of lipid loss. SEM images of the ultramicrotomed hair coated with Pt (left), optical microscopy images and the corresponding in situ Raman image (right). A bright color means a high Raman intensity, i.e., a high density of wax esters.

