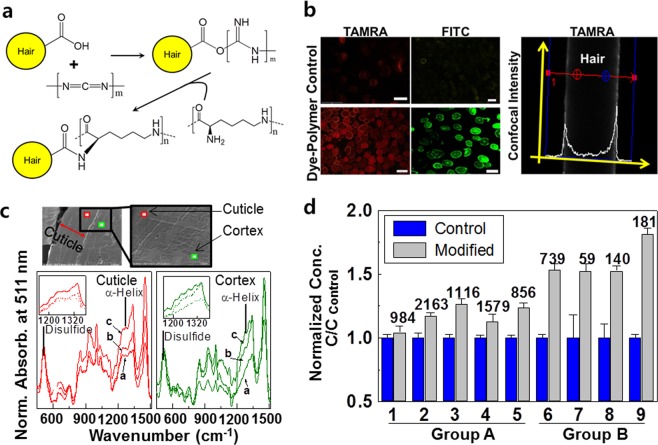
Figure 3.
Effect of internal modification of hair on the properties of lipid loss in response to surfactant. (a) Schematic diagrams depicting the process of internal modification. (b) Fluorescence images (left) of TAMRA-labeled polylysine and FITC-labeled one showing penetration into the hair treated with 5% polylysine and 5% PCI overnight. Scale bars represent 100 μm. The bright color represents polymer penetrated into hair. Confocal microscopic intensity from TAMRA-labeled polylysine (right) is represented by white curve. Data acquisition for the confocal signal by z-stack was performed between blue lines. Hair was treated with TAMRA-labeled polymer for 30 min. (c) SEM image of microtomed hair and Raman spectra after immersion in pure water (a) and a solution containing 5% polylysine only (b), and after sequential immersion in each solution containing 5% polylysine and 5% PCI (c). (d) The concentration of the remaining lipids after washing the internally modified hair by rubbing 10 times. The normalized concentration was calculated based on the average concentration of unmodified hair (control). The numbers represent the actual concentrations (μg/g hair) of lipids extracted from internally modified hair. The numbers on the x-axis represent lipid described in Table 1.

