Fig. 3.
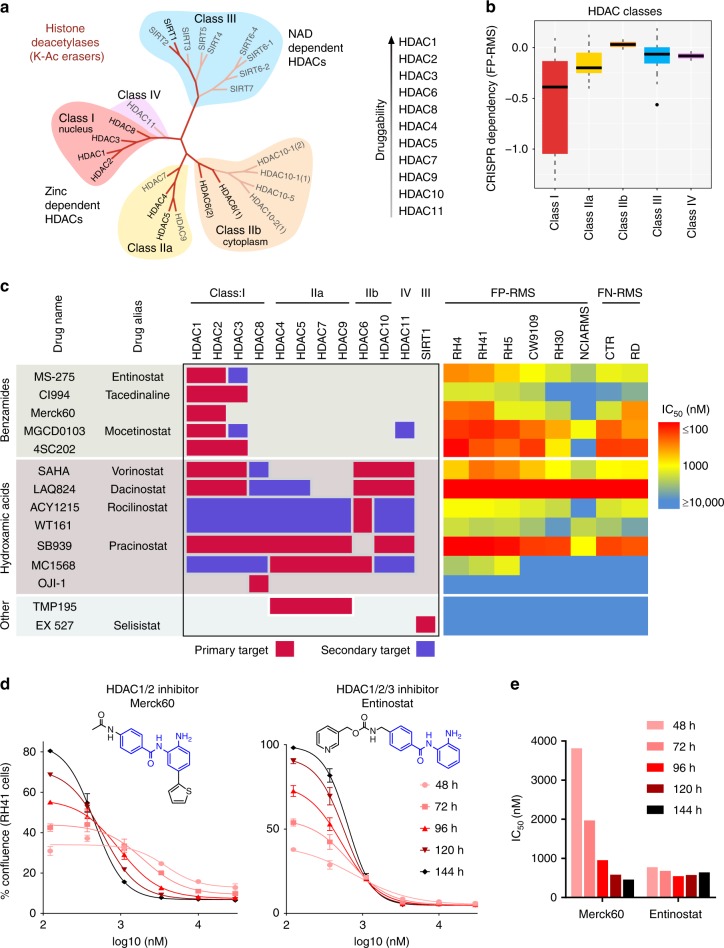
Chemical phylogenetics of HDAC sensitivity. a Phylogenetic tree of histone deacetylases. b CRISPR screening of HDAC isoforms in FP-RMS cells from Broad Achilles dataset reveals strongest dependency on Class I. The panel shows summary statistics as a box (quartiles) and whisker (1.5*inter-quartile range) plot. c Diverse HDAC inhibitors with varying selectivity for HDAC isoforms, shown on the left, with each compounds concentration of half-maximal efficacy (IC50) on the right (measured by impact on cell growth over time). d Dose–response curves of RH41 cell growth impaired by benzamide-based inhibitors of HDAC1/2 (Merck60) and HDAC1/2/3 (Entinostat) over time. Points represent mean and error bars show SEM of triplicate measurements. e Rapid stabilization of IC50 from Entinostat, compared to gradual decline in IC50 with Merck60, corresponding to RH41 cell growth data presented in b

