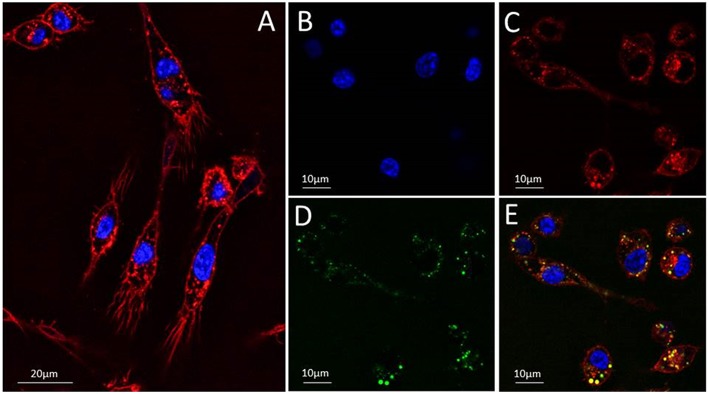
Figure 2.
Tracking the translocation of Alexa Fluor 488-labeled RNase3 into RAW 264.7 mouse macrophages. (A) macrophages cells were stained with Hoechst and Deep Red to visualize the nuclei (blue) (B) and membranes (red) (C), respectively. (D) The protein location was registered after 30 min of macrophages post-treatment with Alexa Fluor 488-RNase3 (green). A panel showing merged images is shown in (E). Protein tracking assays were performed using 2.5 × 10⁵ cells/mL and adding 2 μM of labeled protein final concentration. The images were taken using a Leica TCS SP5 AOBS microscope (see Materials and Methods section for more details).

