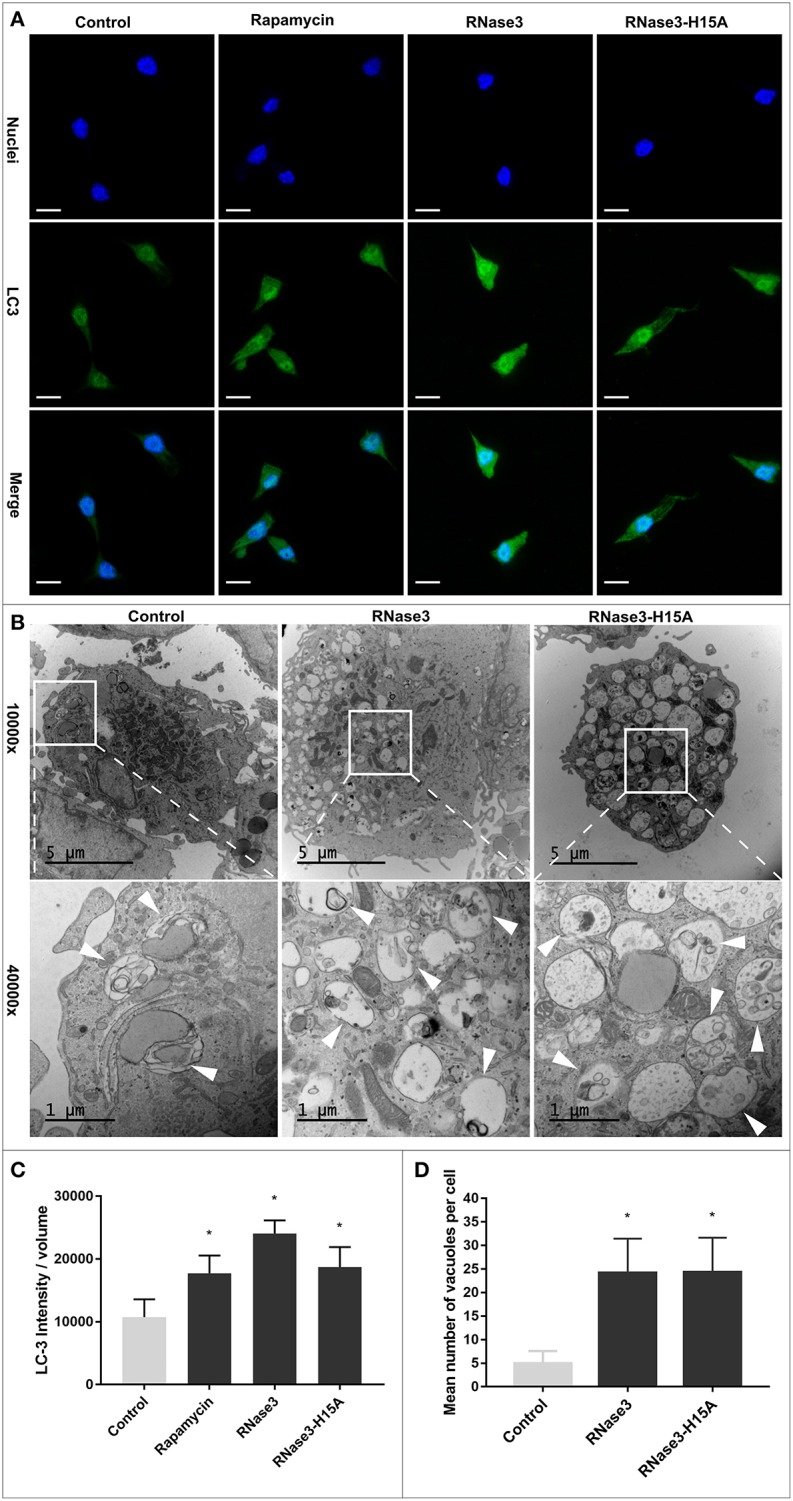
Figure 5.

RNase3 and RNase3-H15A induce autophagic vacuole formation and LC3 processing. (A) Immunofluorescence microscopy analysis of LC3 processing, Mouse macrophages were infected with M. aurum and treated with 10 μM of RNase3, or 10 μM RNase3-H15A mutant, or 100 nM Rapamycin for 24 h. After treatment, the cells were fixed and stained with Hoechst to visualize the nuclei (blue), and with anti-LC3 followed by the addition of Alexa Fluor 488-conjugated anti-rabbit IgG (green). One representative immunofluorescence image out of 3 independent replicates are shown; scale bars: 10 μm; (B) Representative transmission electron microscopy images of M. aurum infected RAW264.7 cells treated with 10 μM RNase3 or 10 μM RNase3-H15A. Autophagic vacuoles are indicated by white arrow; (C) Quantitative analysis of LC3 intensity normalized with cell volume from 3 replicates. Results are shown from 3 independent experiments (mean ± SD). *Statistically significant differences compared with the control sample are indicated (p value ≤ 0.05). (D) total number of autophagic vacuoles per cell for 30 cells randomly selected per each treated sample. Autophagic vacuoles were defined as double-membrane vacuolar structures containing recognizable cytoplasmic contents. *Statistically significant differences compared with the control sample are indicated (p-value ≤ 0.05).
